Download
1 / 11
110 likes | 243 Vues
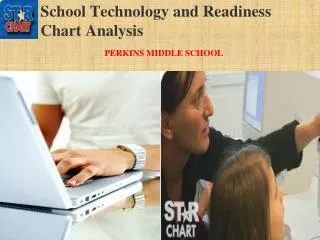
School Technology and Readiness Chart Analysis. PERKINS MIDDLE SCHOOL. STaR Chart Overview. What is StaR Chart? Measures campus technology levels of usage/need and progress in use Developed around four key areas of the Long-Range Plan for Technology, 2006-2020

E N D
School Technology and Readiness Chart Analysis PERKINS MIDDLE SCHOOL
STaR Chart Overview • What is StaR Chart? • Measures campus technology levels of usage/need and progress in use • Developed around four key areas of the Long-Range Plan for Technology, 2006-2020 • Teaching and Learning; Educator Preparation and Development; Leadership, Administration and Instructional Support; Infrastructure for Technology
STaRChart Key Areas • Key Area I: Teaching and Learning • Key Area II: Educator, Preparation, and Development • Key Area III: Leadership, Administration, and Instructional Support • Key Area IV: Infrastructure and Technology
STaRChart Classifications • Early Technology • Developing Technology • Advanced Technology • Target Technology
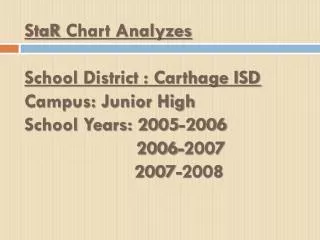
Campus Data Variations in Key Areas 21-24 Target Technology 12-20 Advanced Technology 18 17 16 16 16 15 15 13 14 12 9-14 Developing Technology 11 10 6-8 Early Technology
Area of Concern (Educator Preparation and Development )
Campus STaR Chart Overview Educator Preparation and Development in Extreme Decline due to Professional Development Issues All Other Areas Show Steady Improvement Significant/Positive Growth Level in 3 Years Campus Data Shows Progress Towards Target Area
Recommendations to Reach Target Technology Level • Provide consistent and productive Professional Development to maintain interest in tech use • Provide timely Tech Support to minimize teacher frustration in using technology • Keep Technology Equipment and Software Up-to-Date • Provide continuous access/training to Online Learning or Planning such as Gaggle.net and Project Share
Conclusions Keep STaR Chart as part of the planning process for campus progress towards Target Level Effectively Address Technology TEKS/Standards to meet Long Range Technology Plan Goals Foster Teachers that will develop and implement Technology Skills to help students succeed
References Bing Images - Image Source Page: http://www.bing.com/images/search?q=school+technology+and+readiness+chart&qs=AS&sk=#x0y0. • Long Range Technology Plan 2006-2020. (2006). Retrieved July 6, 2011, fromhttp://www.tea.state.tx.us/index2.aspx?id=5082&menu_id=2147483665. • Star Chart Data. (2008-2011). Perkins Middle School Star Chart. Retrieved July 6, 2011, from http://starchart2.esc12.net/.