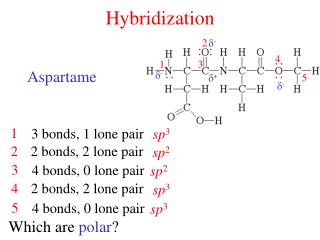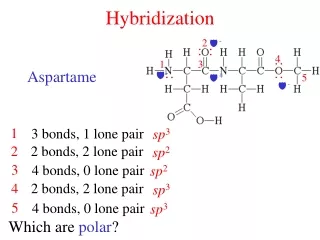
Microarray hybridization
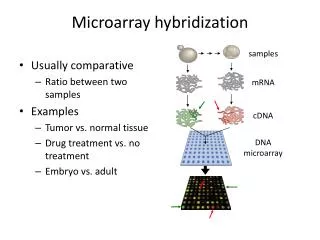
samples. mRNA. cDNA. DNA microarray. Microarray hybridization. Usually comparative Ratio between two samples Examples Tumor vs. normal tissue Drug treatment vs. no treatment Embryo vs. adult. 2. Spotting DNA on the chip. Types of printing pins. Apply small droplets on contact.

Microarray hybridization
E N D
Presentation Transcript
samples mRNA cDNA DNA microarray Microarray hybridization • Usually comparative • Ratio between two samples • Examples • Tumor vs. normal tissue • Drug treatment vs. no treatment • Embryo vs. adult
Types of printing pins Apply small droplets on contact Capillary action on contact Spray droplets under pressure Pin stamps DNA on contact
Synthesis of High Density Oligonucleotide Arrays by Photolithography/Photochemistry
Scanning of microarrays laser • Confocal laser scanning microscopy • Laser beam excites each spot of DNA • Amount of fluorescence detected • Different lasers used for different wavelengths • Cy3 • Cy5 detection
Target Preparation and Hybridization Hybridization of target with spotted slides by GeneTAC Hybstation Quantification of Cy3 & Cy5 labeled target using Nanodrop
DIFFERENT STEPS IN HIGH THROUGHPUT STUDIES OF PLANT GENES Control and water Stressed Cotton plants cDNA Library construction RNA Isolation PCR amplification of clones Preparation of Cy3 and Cy5 labeled TARGET Spotting of slides with PCR amplified clones using MicroGrid II 610 Hybridization of target with spotted slides by GeneTAC Hybstation Slide Image after hybridization Scanning of slides by GeneTAC UC4X4
Scanning of Hybridized Slides Co-expressed Up-regulated Down-regulated Image files of hybridized slide in both Cy3 and Cy5 channels
Scanning Hybridized Microarray Excitation Laser 1 Laser 2 Emission Monochrome pictures combined (two-color arrays)
Image Segmentation Numerical Data Scanned Image Segmentation Software
Analysis of hybridization • Results given as ratios • Images use colors: Cy3 = Green Cy5 = red Yellow • Yellow is equal intensity or no change in expression
Intensity-dependent bias M>0: Cy3>Cy5 M<0: Cy3<Cy5 Low intensities High intensities M = log(Cy3/Cy5) * Global normalization cannot remove intensity-dependent biases A
We expect the M vs A plot to look like: M = log(Cy3/Cy5) A
LOWESS (Locally Weighted Scatterplot Smoothing) Estimated values of log2(Cy5/Cy3) as function of log10(Cy3*Cy5) • Local linear regression model • Tri-cube weight function • Least Squares