Inclusive Growth
210 likes | 344 Vues
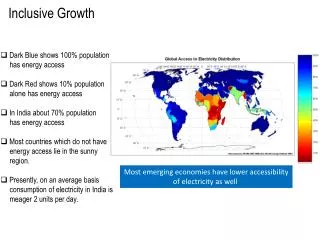
Inclusive Growth. Luc Christiaensen Office of the Chief Economist, Africa Region, World Bank Presentation at Research Institute Meeting Lusaka, 19 Sept, 2014. I n the last decade, A frican growth proved resilient…. Annual growth in GDP, 2003-2013: selected country groupings.

Inclusive Growth
E N D
Presentation Transcript
Inclusive Growth Luc Christiaensen Office of the Chief Economist, Africa Region, World Bank Presentation at Research Institute Meeting Lusaka, 19 Sept, 2014
In the last decade, African growth proved resilient… Annual growth in GDP, 2003-2013: selected country groupings Source: World Bank, Africa’s Pulse vol. 9 Note: average growth between 2003-2014 for SSA (5.1%), SSA excl. South Africa (5.9%) and Developing countries excl. China (4.7%)
… at around 2.4% p.a. in per capita terms. Annual growth in GDP per capita, 2003-2013: selected country groupings Source: World Bank, Africa’s Pulse vol. 9 Note: average growth between 2003-2014 for SSA (2.4%), SSA excl. South Africa (3.2%) and Developing countries excl. China (3.1%)
As a result, Africa’s poverty incidence fell, but not spectacularly In the last ten, extreme poverty fell by ten percentage points in Africa,. Source: PovcalNet.
This “poverty reduction – growth gap” reflects the region’s low growth elasticity of poverty… Bigger impact of each percentage point of growth on poverty reduction Source: estimates based on PovcalNet and WDI.
… which in turn reflects high inequality… Most African countries have high levels of consumption or income inequality, relative to the rest of the world. Seven of the ten most unequal countries in the world today are in SSA. Source: PovcalNet
…and a growth pattern that is often not inclusive Between 2004 and 2010, average p.c. household consumption grew by 6.5% in Malawi. But whereas the top 5% of the population experienced annual growth rates of almost 8%, the bottom 5% grew by between 1% and 3%. Source: estimates based on household surveys from “Survey-based Harmonized Indicator Program (SHIP)”
For inclusiveness, the source and location of growth matters - Evidence from modeling Growth from agriculture more poverty reducing, but also substantial heterogeneity in poverty reducing effects in growth from nonagricuture Source: Dorosh and Thurlow, 2013
For inclusiveness, the location and source of growth matters - Evidence from micro data Insights from Uganda (2005-2009) Source: Christiaensen and Kaminski, 2014
Nonagriculture drives consumption growth Insights from Uganda (2005-2009) Source: Christiaensen and Kaminski, 2014
Agriculture drives poverty reduction growth Insights from Uganda (2005-2009) Source: Christiaensen and Kaminski, 2014 2/3 of growth due to income growth among people in nonag (Kampala); > 2/3 of poverty reduction due to increase in ag incomes
Together with rural nonfarm employment Insights from Uganda (2005-2009) Source: Christiaensen and Kaminski, 2014 1/3 of poverty reduction due to rural income diversification(mainly rural self employment) and 20% of income growth
Increasing productivity of rural household enterprises along with agricultural productivity is key for poverty reduction In sum
Not all agricultural growth is equally poverty reducing World Bank: Africa’s Pulse Vol 9, 2013
Not all agricultural policies are equally poverty reducing Zambia Rwanda 2006-2011: tripling of cereal output, 73% increase in cereal yield, 52% increase in R&T yields Poverty declined by 12%point, 45% coming from agriculture (productivity and marketing) Crop Intensification Program (concentrated support on smallholders, focused on one crop; fertilizer subsidized 1 yr) • 2006-2011: doubling of maize & cereal output; > 50% through yield increase • Poverty – remained virtually stagnant • Policies: above market floor prices and fertilizer subsidies Elaborate the strategic goals – focus on the staples Evidence based policies necessary
Other Factors and Increased Unexplained Part Agricultural 30% Production 35% Non - Farm Wage Employment 3% Increased Non - Farm Self Agricultural Employment Commercialization 13% 10% Decreased Dependency Ratio 9% Agriculture drives poverty reduction in Rwanda(14% points between 2001 and 2011)
And growth that takes place “away from the poor” can also be harnessed • The natural resource sector is seldom directly pro-poor • The rents it generates should typically be re-invested • Building other forms of capital to replace the natural capital being depleted • Cash transfers targeted to the poor have a place in that investment portfolio
The “CCT revolution” in social protection… • Since the late 1990s, conditional cash transfers have shown that: • Good targeting is possible • Transfers to increase family incomes and reduce poverty • Households use the transfers to improve nutrition,…
…is coming to Africa. …increase investments in human capital; Source: Baird et al. (2013)
Thank you for your attentionhttp://www.worldbank.org/en/region/afr/brief/office-of-chief-economist-in-the-africa-region-afrce