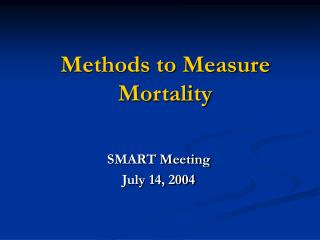
CONTEMPORARY METHODS OF MORTALITY ANALYSIS
1.22k likes | 1.89k Vues
CONTEMPORARY METHODS OF MORTALITY ANALYSIS. Lecture 2 Leonid Gavrilov Natalia Gavrilova. Measures of Mortality. Crude Death Rate Age-Specific Death Rates (Age-Specific Mortality Rates) Age-Adjusted Mortality Rates (Standardized Mortality Rates) Life Expectancy (at birth or other age)

CONTEMPORARY METHODS OF MORTALITY ANALYSIS
E N D
Presentation Transcript
CONTEMPORARY METHODS OF MORTALITY ANALYSIS Lecture 2 Leonid Gavrilov Natalia Gavrilova
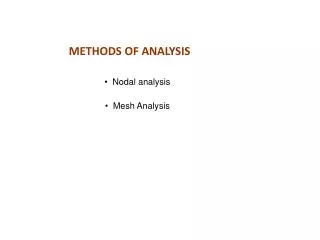
Measures of Mortality • Crude Death Rate • Age-Specific Death Rates (Age-Specific Mortality Rates) • Age-Adjusted Mortality Rates (Standardized Mortality Rates) • Life Expectancy (at birth or other age) • Measures of Infant Mortality
Crude Death Rate • Number of deaths in a population during a specified time period, divided by the population size "at risk" of dying during that study period. • For one-year period, Crude Death Rate, CDR = Deaths in that year /mid-year population size x 1,000 to adjust for standard-sized population of 1,000 persons mid-year population = total population for July 1
Crude Death Rate Pros and Cons • Pros: - Easy to calculate, and require less detailed data than other mortality measures - Useful for calculation of the rate of natural increase (crude birth rate minus crude death rate) • Cons: - Depends on population age structure (proportions of younger and older people)
Trends in crude death rates (per 1,000) for Russia, USA and Estonia
Distribution of crude death rates (per 1,000) in Russia, 2003
Age-Specific Death Rates (ASDR) or Age-Specific Mortality Rates (ASMR) • Number of deaths in a specific age group during a specified time period, divided by the size of this specific age group during that study period. Example: For one-year study period, Age-Specific Death Rates, ASDR for males at age 45-49 years = = Deaths to males aged 45-49 in that year / Number of males aged 45-49 at mid-year x 1,000 to adjust for standard-sized population of 1,000 persons of that age.
Age-Specific Death Rates Pros and Cons • Pros: - Allows to study mortality by age (and sex) • Cons: - Requires detailed data on deaths by age (not always available for developing countries, war and crisis periods, historical studies)
Age-adjusted death rate (ADR), standardized death rate (SDR) or age-standardized death rate (ASDR) • Death rate expected if the studied population had the age distribution of another "standard" population (arbitrary chosen for the purpose of comparison). Calculated as weighted average (with weights being proportions of the "standard" population at each age)
Age-Adjusted Death Rate or Age-Standardized Death Rate • Direct method of age standardization: • Mui is mortality rate in the studied population at age i • Psi – number of persons at age i in the standard population. Ps – total standard population.
Age-Adjusted Death Rate or Age-Standardized Death Rate • Pros: - Allows comparison of death rates of populations despite differences in their age distribution • Cons: - Requires data on death rates by age (not always available for developing countries, war and crisis periods, historical studies) - Results of comparison may depend on the arbitrary choice of standard.
Typical standard populations • European standard population and World standard population suggested by the World Health Organization • In the United States: 1940 U.S. standard population and 2000 U.S. standard population (applied around 2003)
The Concept of Life Table • Life table is a classic demographic format of describing a population's mortality experience with age. Life Table is built of a number of standard numerical columns representing various indicators of mortality and survival. The concept of life table was first suggested in 1662 by John Graunt. Before the 17th century, death was believed to be a magical or sacred phenomenon that could not and should not be quantified. The invention of life table was a scientific breakthrough in mortality studies.
Life Table • Cohort life table as a simple example • Consider survival in the cohort of fruit flies born in the same time
Number of survivors at the beginning of the next age interval: l(x+1) = l(x) – d(x) Probability of death in the age interval: q(x) = d(x)/l(x)
Person-years lived in the interval, L(x) L(x) are needed to calculate life expectancy. Life expectancy, e(x), is defined as an average number of years lived after certain age. L(x) are also used in calculation of net reproduction rate (NRR)
Calculation of life expectancy, e(x) Life expectancy at birth is estimated as an area below the survival curve divided by the number of individuals at birth
Life expectancy, e(x) • T(x) = L(x) + … + Lω where Lω is L(x) for the last age interval. Summation starts from the last age interval and goes back to the age at which life expectancy is calculated. • e(x) = T(x)/l(x) where x = 0, 1, …,ω
Life Tables for Human Populations • In the majority of cases life tables for humans are constructed for hypothetic birth cohort using cross-sectional data • Such life tables are called period life tables • Construction of period life tables starts from q(x) values rather than l(x) or d(x) as in the case of experimental animals
Formula for q(x) using age-specific mortality rates a(x) called the fraction of the last interval of life is usually equal to 0.5 for all ages except for the first age (from 0 to 1) Having q(x) calculated, data for all other life table columns are estimated using standard formulas.
Life table probabilities of death, q(x), for men in Russia and USA. 2005
Period life table for hypothetical population • Number of survivors, l(x), at the beginning is equal to 100,000 • This initial number of l(x) is called the radix of life table
Life table number of survivors, l(x), for men in Russia and USA. 2005.
Life table number of dying, d(x), for men in Russia and USA. 2005
Trends in life expectancy for men in Russia, USA and Estonia
Trends in life expectancy for women in Russia, USA and Estonia
Special methods based on life table approach • Multiple decrement life tables • Cause-elimination life tables • Decomposition of life expectancy
Multiple decrement life tables • Multiple decrement life tables • Often used to construct life tables by cause of death • In this case decrements are different causes of death
Multiple decrement life tables vs ordinary life tables • In an ordinary life table, membership in a well-defined cohort can be terminated by a single attrition factor. • In a multiple-decrement life table, there are multiple reasons for attrition (death). • Ordinary life tables can be used to answer questions about longevity. • A multiple-decrement life table will be used to answer the question, "What is the probability that a newborn will die due to a specific cause before reaching age 65?“ • In an ordinary life table of mortality it is assumed that everyone eventually dies. • The multiple-decrement life table will provide the probability that a person will eventually die due to a specific cause.
Multiple decrement life table – steps of construction • Construct an ordinary life table • Calculate probabilities of death from cause k
Multiple decrement life table – steps of construction (continue) • Calculate number of decrements from causek in age interval(x, x+n): • Calculate numbers of survivors to age y for those who eventually die from cause k during his/her life:
Multiple decrement life table – steps of construction (continue) • Calculate life-time probability of dying from cause k : lk/l0 • Calculate mean expected age at death from cause k by calculating Lkx and Tkx • Calculated as life expectancy in the ordinary life table
Mean expected age at death by cause,women, Russia Васин С., доклад в Киеве 2006
Comparison of mortality structure for Russia and Western countries1965 Vassin, 2006
Comparison of mortality structure for Russia and Western countries2004 год Васин С., доклад в Киеве 2006
Decomposition of life expectancy • Suggested by Andreev (1982), Pollard (1982) and Arriaga (1984)
Decomposition by age Where values lx, Lx, Tx represent standard functions from ordinary life table, and notations 1 and 2 correspond to populations 1 and 2 respectively (comparing populations). Thus, we need first to calculate ordinary life tables for populations 1 and 2
Decomposition by age (continue) The last open age interval
Decomposition by contribution of different causes of death where Rix designates a proportion of deaths from cause i in age group (x, x+n), which is Dix/Dx. In this case Dix corresponds to the observed number of deaths from cause i in age interval (x, x+n), and Dx is a corresponding number of deaths from all causes.
Decomposition by causes of death (continue) Notations (1) and (2) correspond to comparing populations. Valuesmxcorrespond to life table mortality rates derived from ordinary life tables, becausemx = dx/Lx. In this formula value Δxcorresponds to contribution of differences in mortality from all causes of death in age interval (x, x+n) to the observed differences in life expectancy. It can be shown that
Decomposition of the U.S.-Russia gap in life expectancy by cause USA – 1999; Russia – 2001. Source: Shkolnikov et a. Mortality reversal in Russia.
Decomposition of the U.S.-Russia gap in life expectancy by cause USA – 1999; Russia – 2001. Source: Shkolnikov et a. Mortality reversal in Russia.
Additional reading Preston S. H., Heuveline P., Guillot M. Demography. Measuring and modeling population processes. Blackwell Publ., Oxford, 2001.
Cause elimination life table • Uses an additive property of hazard rate • Chiang’s method (1978) – assumes proportionality of hazard rates from different causes
Main formula for cause elimination life table In this formula notation –kmeans that probability of death is related to cause elimination (not a power). Proportionality ratiorkcan be obtained from the observed number of deaths in a particular age interval: