Download
1 / 25
250 likes | 431 Vues
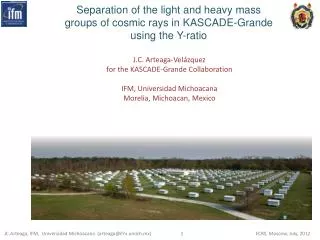
The energy spectrum from the KASCADE-Grande muon data. Juan Carlos Arteaga-Velázquez for the KASCADE-Grande Collaboration. Institute of Physics and Mathematics Universidad Michoacana.

E N D
The energy spectrum from the KASCADE-Grande muon data Juan Carlos Arteaga-Velázquez for the KASCADE-Grande Collaboration Institute of Physics and Mathematics Universidad Michoacana Energy spectrum from muon data – J.C. Arteaga Karlsruhe, December 2008
Outline • Structure of the talk • Quality cuts • Efficiency studies • Muon correction functions • The muon spectra • The Integral flux • Attenuation curves • Adding muon data with the CIC method • Conversion into Energy • Energy spectrum • Summary Energy spectrum from muon data – J.C. Arteaga Karlsruhe, December 2008
1) Quality cuts • Data sets: • MC data: Kreta v1.18.03 • KG data: Kreta v1.18.04 • Quality cuts: • 0 < 40o • Rectangle: A 1.924 x 10⁵ m2 • Ndtg > 19 • Successfully reconstructed • Nctot • log10(Nctot/8.5) > 2.9 log10(Ne/3.5) -10/3.5 • N ≥ 2 105 • Ne ≥ 1 105 • Sven´s data quality base • - No hardware, clock problems • - Anka cut • - No missing muon clusters • Iact & 1 • Fanka < 4 Energy spectrum from muon data – J.C. Arteaga Karlsruhe, December 2008
2) Efficiency studies Working in region of maximum efficiency (E 2.5 1016 eV) Energy spectrum from muon data – J.C. Arteaga Karlsruhe, December 2008
3) Muon correction functions N corrected for systematic effects: N corrected N no corrected Energy spectrum from muon data – J.C. Arteaga Karlsruhe, December 2008
3) Muon correction functions N corrected N no corrected Energy spectrum from muon data – J.C. Arteaga Karlsruhe, December 2008
3) Muon correction functions N corrected N no corrected Energy spectrum from muon data – J.C. Arteaga Karlsruhe, December 2008
3) Muon correction functions Distribution of the systematic error of corrected N Width ~ 0.14 Use bin log10(N) = 0.1 Energy spectrum from muon data – J.C. Arteaga Karlsruhe, December 2008
4) The muon spectra teff = 754.3 days Energy spectrum from muon data – J.C. Arteaga Karlsruhe, December 2008
4) The muon spectra Importance of the Ncorrection function p1 = -2.19 0.02 p1 = -2.43 0.02 Energy spectrum from muon data – J.C. Arteaga Karlsruhe, December 2008
5) The integral flux Work in region of maximum efficiency and statistics Apply cut at constant J(>N) For a given J, get N() Energy spectrum from muon data – J.C. Arteaga Karlsruhe, December 2008
6) Attenuation curves Get attenuation curves Choose the closest curve to N() Energy spectrum from muon data – J.C. Arteaga Karlsruhe, December 2008
6) Attenuation curves Energy spectrum from muon data – J.C. Arteaga Karlsruhe, December 2008
6) Attenuation curves 2 per degree of freedom when using a polynomial of 2nd and 1st degree in Sec for the fit In general, lower values for Pol. 2nd degree Energy spectrum from muon data – J.C. Arteaga Karlsruhe, December 2008
7) Adding muon data with CIC method Find reference angle ref for normalization: ref = mean = 23.7o Energy spectrum from muon data – J.C. Arteaga Karlsruhe, December 2008
7) Adding muon data with CIC method Muon spectra after applying CIC method Good agreement: Difference from vertical spectrum is less than 3σ Energy spectrum from muon data – J.C. Arteaga Karlsruhe, December 2008
7) Adding muon data with CIC method Adding all muon spectra after applying CIC method Energy spectrum from muon data – J.C. Arteaga Karlsruhe, December 2008
8) Conversion into Energy FLUKA/QGSJET II Fit in region of maximum efficiency and statistics Energy spectrum from muon data – J.C. Arteaga Karlsruhe, December 2008
8) Conversion into Energy Systematic error in reconstruction of energy: Energy spectrum from muon data – J.C. Arteaga Karlsruhe, December 2008
9) Energy spectrum Assuming mixed composition Energy spectrum from muon data – J.C. Arteaga Karlsruhe, December 2008
9) Energy spectrum Change Ne cut to access region of lower energies? Energy spectrum from muon data – J.C. Arteaga Karlsruhe, December 2008
9) Energy spectrum Systematics due to uncertainty in primary composition H Fe Energy spectrum from muon data – J.C. Arteaga Karlsruhe, December 2008
9) Energy spectrum Kreta v1.18/04 vs v1.18/02 Good agreement! Energy spectrum from muon data – J.C. Arteaga Karlsruhe, December 2008
9) Energy spectrum Energy spectrum from muon data – J.C. Arteaga Karlsruhe, December 2008
9) Summary • A preliminary all-particle primary energy spectrum was obtained from the muon data of KASCADE-Grande using the CIC method. • Agreement between results from Kreta v1.18/04 and v1.18/02. • According to CIC method, muon spectra corresponding to different are in good agreement. • By taking into account muon correction functions a change in slope of muon spectra is observed. • Calculation of systematics with new Kreta version are under way. Energy spectrum from muon data – J.C. Arteaga Karlsruhe, December 2008