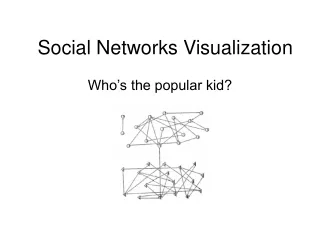
Facebook Social Network Mapping Visualization
Facebook Social Network Mapping Visualization. By Lourdes Chang. Contents. Introduction Social Networks Facebook background Synthetic Data Application description Demo Related Work Future Work Conclusion. Introduction.


Facebook Social Network Mapping Visualization
E N D
Presentation Transcript
Facebook Social Network Mapping Visualization By Lourdes Chang
Contents • Introduction • Social Networks • Facebook background • Synthetic Data • Application description • Demo • Related Work • Future Work • Conclusion
Introduction • “A good friend is a connection to life - a tie to the past, a road to the future, the key to sanity in a totally insane world” (Lois Wyse) • “Show me your friends and I will show you your future” (John Kuebler)
Social Networks • Classmates.com • Friendster • mySpace • LinkedIn • Twitter • Xanga • Facebook • Etc.
Facebook • More than 400 million active users • Average user has 130 friends • About 70% of Facebook users are outside of the United States [1] “Statistics | Facebook”. http://www.facebook.com/press/info.php?statistics, 2010
Facebook • Email address • Interests • Activities • Notes • Birthday • Photos/Videos • Education history • Relationship status • Events/Social gatherings • Religion • Groups that they belong to • Friend list • Hometown/Current location • Website
Synthetic Data • Database • All cities in the United States • Longitude and latitude • Geocoder (Google Maps API) • Create test files • XML
Synthetic Data • Algorithm • Base • One person is the host “friend”, has x friends • His friends are known as friend[0], friend[1],….,friend[x] (base string) • Friends of friends • Select one friend, has y friends • Base string + [.] + [0,1,….,y]
Application description • Contains • Map with sidebar (Google Maps API) • Control buttons • Map interactions • Two graphs • Pie (Bluff library) • Bar (HTML-Graphs) • HyperTree (JavaScript Visualization Toolkit) • Tree interactions
Related Work • Vizster • Friendster • Facebook API • Too long • Permissions
Future Work • Coupling and decoupling map and HyperTree • Calculate how many people fall under a certain range (radial) • Other information other than location
Conclusion • No real data, no real conclusion • Universal web application • XML file
References [1] “Statistics | Facebook”. http://www.facebook.com/press/info.php?statistics, 2010 [2] Sweeny, Charles. “List of Cities and Countries”. http://listofcitiesandcounties.com/, 2010 [3] Belmonte, Nicolas Garcia. “JavaScript InfoVis Toolkit - Interactive Data Visualizations for the Web” http://thejit.org/docs/files/Hypertree-js.html, 2010 [4] Mani, Venkat. “Google Map – Facebook Mashup!!!” http://thetechstig.com/?page_id=35, 2009 [5] Williams, Mike. “Google Map API Tutorial” http://econym.org.uk/gmap/, 2010 [6] “MarkerClusterer for V3”. http://google-maps-utility-library-v3.googlecode.com/svn/trunk/markerclusterer/docs/reference.html [7] Veness, Chris. “Calculate distance, bearing and more between Latitude/Longitude points”. http://www.movable-type.co.uk/scripts/latlong.html [8] Tentler, Gerd. “Gerry’s Script Library”. http://www.gerd-tentler.de/tools/ [9] Boyd, Danah. Heer, Jeffrey. “Vizster | Visualizing online social networks”. http://hci.stanford.edu/jheer/projects/vizster/, 2005 [10] Boyd, Danah, Ellison Nicole B. “Social Network Sites: Definition, History, and Scholarship”. http://jcmc.indiana.edu/vol13/issue1/boyd.ellison.html. 2007 [11] Facebook. http://www.facebook.com