Exploring Top Network Visualization Software: Gephi, Tulip, and Visone
Dive into the world of network visualization with leading software tools like Gephi, Tulip, and Visone. Gephi excels with features like 3D rendering, dynamic analysis, and extensive customization options, capable of handling large datasets. Tulip supports up to 1 million nodes and offers automated clustering and graph cleansing. Visone stands out for its user-friendly interface and social network optimization, providing high-quality exports. Discover the unique capabilities of each software to enhance your data visualization projects.


Exploring Top Network Visualization Software: Gephi, Tulip, and Visone
E N D
Presentation Transcript
Network Visualization Software a few examples Sarah Koo stats 319 - 2.8.11
“Facebook5” Dataset Caltech (769 Nodes, 16656 Edges) Princeton (6596 Nodes, 293,320 Edges) UNC Chapel Hill (18163 Nodes, 766,800 Edges) Oklahoma Georgetown
Tulip • Can handle up to 1 million nodes • 3D visualizations • Automated and manual clustering • Automated coloring • Highly customizable graphs • Extremely detailed even with many data points • Built-in ways to clean up cluttered graphs
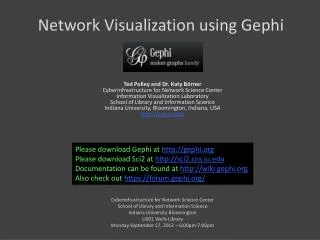
Gephi • Poster creation capability • 3D rendering • Up to 50K nodes, 500K edges • Real-time visualization • Dynamic network analysis: visualizations over time • Tons of plugins
Visone • By far the simplest interface • Built-in R console • Basic network visualization, no fancy features • High-quality export to jpg, pdf, etc. • Specifically designed for social networks