Software Visualization
This exploration into software visualization delves into the intricate relationship between abstract concepts and their tangible representations. From photorealism in images by Peter Eades and Jesse Jin to strategies for depicting complex data sets and biochemical pathways, we unearth the challenges and methodologies that drive effective visualization practices. The work emphasizes how well-crafted visualizations can transform abstract information into accessible formats, enabling better understanding and analysis across diverse domains, including medical imaging and software systems.

Software Visualization
E N D
Presentation Transcript
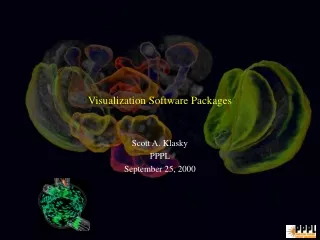
Software Visualization Peter Eades University of Sydney
Bent photorealism • Jesse Jin
Synthesized photorealism • Mitsubishi Electric Research Laboratories
Unseen but imaginable • BMIT group
Unseen but imaginable BMIT group
Something very abstract • Derek Renouf, • Adaptive Arts
Abstract information • KeithNesbitt
Abstract information • Biochemical pathways • Carsten / Rowena • Friedrich
Abstract information • A.S.M. Sajeev, Wendy Wang, Aaron Quigley
Abstract information • Keith Finkelde
Good visualization Beck
Visualization of concrete and abstract things • Concrete Software Visualization Diagrams Abstract Medical images, metro maps Synthetic photorealism Photography
The visualization process • Visualization Data Model Picture Analysis Making pictures
The software visualization process • Software Visualization Graph Drawing Graph Program Analysis We want to create good visualizations of software Making pictures
Machine speed • MIPS per dollar MIPS 1950 1960 1970 1980 1990 2000
Software size: lines of source code • Line of code in the world ? 1950 1960 1970 1980 1990 2000
Software size: number of files • Number of files • in MS windows 6000 5000 4000 3000 2000 1000 Win2000 Win98 Win95 Win3.1 1989 1995 1998 2000
Demand for software Software size: number of programmers • Number of programmers in Australia 1950 1960 1970 1980 1990 2000
Software interactions Interactions of a typical program with other programs ? 1950 1960 1970 1980 1990 2000
Design for a LEGO elephant 1 2 3 4 5 6 8 7
Software and elephants • Modern software is more like a REAL elephant than a LEGO elephant • The real elephant is large and complex • The real elephant evolved, it was not designed • There are no design documents • Many components of the real elephant seem familiar, but a little different • The real elephant interacts with its environment in a very complex way • There are many different views of the real elephant, and no one human can see the whole picture • The real elephant can be cumbersome • It is difficult to investigate the insides of the real elephant without hurting it
Software and elephants • Understanding modern software systems is something like understanding real elephants
Football transfer graph • In the 2001 season, • Drew will move from the Panthers to the Eels • Miles will move from the Roosters to the Eagles • Green will move from the Cowboys to the Roosters • O’Hara will move from the Bulldogs to the Raiders • . . . . . .
Entity Entity Edge Node Node Football transfer graph Relationship Team Team Player Transfer Graph
Football transfer graph • Relational information is often represented in a table
Green Kimmorley Orford Miles Drew Buetner Prince Solomona Vagana Duckworth Kelly Patten Schifcofske, Hodgson O’Hara Mapp Howland Football transfer graph
A program • #include <stdio.h> • #include <types.h> • #include <point.h> • #include <edge.h> • #include <vertex.h> • #include <defs.h> • define MAX(X,Y) (((X) >= (Y)) ? (X) : (Y)) • #define DeltaX 0.1 • extern vertex *read_cgo(); • extern char *cmap[]; • main() • { • vertex *cgo; • vertex *tree; • int height; • /* • * Read the cgo, Find the root of the tree, (coloured "root") • * draw the tree, remove any added links, and write out the cgo again. • */ • if ((cgo = read_cgo()) == NULL) exit (0); • for (tree = cgo; /* Find root of tree, colour */ • tree && (strcmp (cmap[tree->v_colour], "root") != STREQUAL); • tree = tree->v_next); • Draw_Subtree(tree, &height); • rm_links(cgo); • write_cgo(cgo); • } • /* • * Removes the added links from • Program rt.c • 313 lines of C code • 13 functions • Written about 1987 by Luke Wildman • Draws trees
Program call graph #include <stdio.h> #include <types.h> #include <point.h> #include <edge.h> #include <vertex.h> #include <defs.h> define MAX(X,Y) (((X) >= (Y)) ? (X) : (Y)) #define DeltaX 0.1 extern vertex *read_cgo(); extern char *cmap[]; main() { vertex *cgo; vertex *tree; int height; /* * Read the cgo, Find the root of the tree, (coloured "root") * draw the tree, remove any added links, and write out the cgo again. */ if ((cgo = read_cgo()) == NULL) exit (0); for (tree = cgo; /* Find root of tree, colour */ tree && (strcmp (cmap[tree->v_colour], "root") != STREQUAL); tree = tree->v_next); Draw_Subtree(tree, &height); rm_links(cgo); write_cgo(cgo); } /* * Removes the added links from • Program structure is relational: • Main calls draw_subtree and rm_links • Draw_subtree calls itself, left, right, plot_point, and separate_subtrees • Separate_subtrees calls find_shift, too_close, mklink, anyright, anyleft, and make_shift • Make_shift calls left, right, plot_point, and itself
Program call graph #include <stdio.h> #include <types.h> #include <point.h> #include <edge.h> #include <vertex.h> #include <defs.h> define MAX(X,Y) (((X) >= (Y)) ? (X) : #define DeltaX 0.1 extern vertex *read_cgo(); extern char *cmap[]; main() { vertex *cgo; vertex *tree; int height; /* * Read the cgo, Find the root of the tree, (coloured "root") * draw the tree, remove any added links, and write out the cgo again. */ if ((cgo = read_cgo()) for (tree = Calls Function Function Edge Node Node Graph
Program call graph • We can represent the call relation as a table
Program call graph: diagram #include <stdio.h> #include <types.h> #include <point.h> #include <edge.h> #include <vertex.h> #include <defs.h> define MAX(X,Y) (((X) >= (Y)) ? (X) : #define DeltaX 0.1 extern vertex *read_cgo(); extern char *cmap[]; main() { vertex *cgo; vertex *tree; int height; /* * Read the cgo, Find the root of the tree, (coloured "root") * draw the tree, remove any added links, and write out the cgo again. */ if ((cgo = read_cgo()) for (tree = Lee Dinning
Graphs • A graph consists of • nodes, and • edges, i.e., pairs of nodes • The nodes model entities • the edges model relationships • Graphs model relational information
Graphs Michael Doorley, IRB
Graphs and software • Graphs are used widely as software models • Call graphs • Use-case diagrams • Slicing diagrams • Class hierarchies • ER models • NIAM models • Data flow diagrams • Control flow diagrams
Graphs and software • The analysis phase of software visualization is sometimes called “design recovery”. • Fundamentally, this is the process of extracting a graph from the program. Graph Drawing Program Graph Making pictures Analysis
Graph drawing • The purpose of graph drawing is to untangle diagrams tangled untangled
Graph Drawing • The classical graph drawing problem is to develop algorithms to draw graphs. The input is a graph with no geometry The output is a diagram, a drawing of the graph C A - B, C, D B - A, C, D C - A, B, D, E D - A, B, D, E E - C, D ? A B E D the output drawing should be untangled, easy to understand, beautiful.
Graph Drawing • There are many methods to draw untangled pictures of graphs. • Two such methods: • GIOTTO method • Force-directed method
GIOTTO • Batini et al. began to investigate drawing ER diagrams in the early 1980s. • Aims • Orthogonal drawings • Minimise crossings • Make lines as straight as possible (minimise bends) • Maximise resolution