Software Visualization
Dive deep into software behavior with our dynamic visualization tool that goes beyond UML. Identify errors, bottlenecks, and enhance debugging and understanding of attacks. From test results to execution data, analyze every aspect of your software's performance in real-time. Our multi-layer visualization tool allows you to trace and analyze events across different system layers. Discover the power of visualizing program behaviors at granular levels for effective debugging and tuning. With features like coloured representation and detailed execution data, gain insights to optimize your software efficiently.

Software Visualization
E N D
Presentation Transcript
Software Visualization Presented by Sam Davis
More than Just UML! • UML is about static structure of software • In terms of abstractions like • Procedures • Objects • Files • Packages • But…
Software is Dynamic! • Abstractions are for developers • Users care about behaviour • Visualize behaviour of software at run time • Find errors • Find performance bottlenecks
Test Results • Hundreds, maybe thousands of tests • For each test: • Purpose • Result (pass or fail) • Could be per-configuration or per-version • Relevant parts of the code
Detailed Execution Data • Could be for many executions • Dynamic events as opposed to summary data
Summary Data: Examples • Total running time • Number of times a method was called • Amount of time CPU was idle
Dynamic Events: Examples • Memory allocation • System calls • Cache misses • Page faults • Pipeline flushes • Process scheduling • Completion of disk reads or writes • Message receipt • Application phases
Really Detailed Execution Data • Logging virtual machines can capture everything • Enough data to replay program execution and recreate the entire machine state at any point in time • Allows “time-traveling” • For long running systems, data could span months • Uses: • Debugging • Understanding attacks
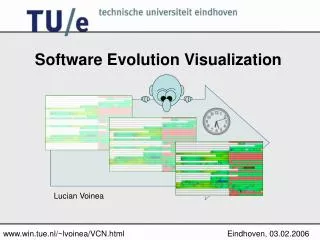
StrataVarious: MultiLayer Visualization of Dynamics in Software System Behavior Doug Kimelman, Bryan Rosenburg, Tova Roth Proc. Fifth IEEE Conf. Visualization ’94, IEEE Computer Society Press, Los Alamitos, Calif., 1994, pp. 172–178.
StrataVarious • Trace-driven program visualization • Trace: sequence of <time, event> pairs • Events captured from all layers: • Hardware • Operating System • Application • Replay execution history • Coordinate navigation of event views
StrataVarious: Main Argument • Debugging and tuning requires simultaneously analyzing behaviour at multiple layers of the system
StrataVarious: Critique • Examples demonstrate usefulness • Fundamentally, a good idea • Increasing importance as multi-core machines become standard • Many windows • Titles not meaningful • Virtual reality cop-out • Dubious claim that tracing does not alter behaviour
SeeSoft • Zoomed out view of source code • Lines of code displayed as thin horizontal lines • Preserve indentation, length • Can colour lines according to data • Link with readable view of code • Allows tying data to source code Stephen G. Eick, Joseph L. Steffen and Eric E. Sumner, Jr. “SeeSoft – A Tool for Visualizing Line-Oriented Software Statistics.” IEEE Transactions on Software Engineering, 18(11):957-968, November 1992.
Visually Encoding Program Test Information to Find Faults in Software (Tarantula) James Eagan, Mary Jen Harrold, James A. Jones, and John Stasko, Proc. InfoVis 2001 pp. 33-36.
Tarantula • Extends SeeSoft idea • Defines colour mapping for LOC based on test results • Goal: use test results to identify broken code
Tarantula • Input: • For each test: • Test number • Result (pass or fail) • Test coverage (list of line numbers)
Tarantula: Discrete Colour Mapping • Based on user tests • Black background • Colour each line • Red if executed by failed tests • Green if executed by passed tests • Yellow if executed by both
Tarantula: Continuous Colour Mapping • Extend discrete colour mapping by • Interpolating between red and green • Adjusting brightness according to number of tests • Possibilities: • Number of passed or failed tests • Ratio of passed to failed tests • Ratio of % passed to % failed
Tarantula: Continuous Colour Mapping • For each line L • Let p and f be the percentages of passed and failed tests that executed L • If p = f = 0, colour L grey • Else, colour L according to • Hue: p / ( p + f ), where 0 is red and 1 is green • Brightness: max( p, f )
Tarantula: Critique • Visualizing test results could be useful, this is a first step • Future work: does colouring help to find broken code? • Colouring: simple idea made complex • Tests identified only by number • Better: name tests • Better still: can we visualize the meaning of tests?
Visualization of Program-Execution Data for Deployed Software(Gammatella) Alessandro Orso, James Jones, and Mary Jean Harrold. Proc. of the ACM Symp. on Software Visualization, San Diego, CA, June 2003, pages 67--76.
Gammatella • Collection and storage of program-execution data • Visualization of data about many executions
Gammatella: Executions • Code coverage and profiling data • Execution properties • OS • Java version • Etc. • Filters • Boolean predicate logic • Summarizers
Gammatella: Coloured, Tri-Level Representation • System level • Treemap of package/class hierarchy • File level: • SeeSoft-like view of code • Statement level: • Source code (coloured text) • Colours based on exceptions • Other colourings possible, e.g. profiling data
One Level Treemap • Layout algorithm for treemap of depth 1 • Preserves relative placement of colours
Gammatella: Critique • Complete system – not just a visualization • Effectively links code to structure • Trial usage discovered useful but high-level information • Mainly relied on system view • Would be nice to see examples using file and statement level views
Visualizing Application Behavior on Superscalar Processors Chris Stolte, Robert Bosch, Pat Hanrahan, and Mendel Rosenblum Proc. InfoVis 1999
Superscalar Processors: Quick Overview • Pipeline • Multiple Functional Units • Instruction-Level Parallelism (ILP) • Instruction Reordering • Branch Prediction and Speculation • Reorder Buffer • Instructions wait to graduate (exit pipeline)
Critique • Most code doesn’t need this level of optimization, but • The visualization is effective, and would be useful for code that does • May reduce the expertise needed to perform low level optimzation • Might be effective as a teaching tool • Bad color scheme: black/purple/brown • Does it scale with processor complexity?
Papers • D. Kimelman, B. Rosenburg, and T. Roth, “Strata-Various: Multi-Layer Visualization of Dynamics in Software System Behavior,” Proc. Fifth IEEE Conf. Visualization ’94, IEEE Computer Society Press, Los Alamitos, Calif., 1994, pp. 172–178. • James Eagan, Mary Jen Harrold, James A. Jones, and John Stasko, "Visually Encoding Program Test Information to Find Faults in Software." Proc. InfoVis 2001 pp. 33-36.
Papers • Alessandro Orso, James Jones, and Mary Jean Harrold. "Visualization of Program-Execution Data for Deployed Software." Proc. of the ACM Symp. on Software Visualization, San Diego, CA, June 2003, pages 67--76. • Chris Stolte, Robert Bosch, Pat Hanrahan, and Mendel Rosenblum, "Visualizing Application Behavior on Superscalar Processors." Proc. InfoVis 1999