Software Evolution Visualization
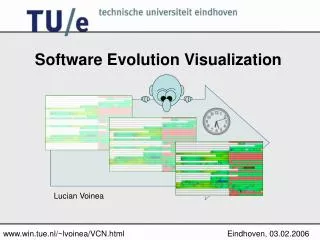
Software Evolution Visualization. Lucian Voinea. Why Software Evolution Visualization ?. Software understanding what is the structure of the project ? what is important ? what is difficult ? who work on it ? what parts are connected to a given part ?

Software Evolution Visualization
E N D
Presentation Transcript
Software Evolution Visualization Lucian Voinea
Why Software EvolutionVisualization? • Software understanding • what is the structure of the project ? • what is important ? • what is difficult ? • who work on it ? • what parts are connected to a given part ? • what parts refer to a given aspect ? • Product and process assessment • what is the process ? • what is the core team ? • where is the activity concentrated ? • what is stable ?
Challenges • Data acquisition • data source SW Configuration Management • long acquisition times • large storage space, large bandwidth • data parsing & maintenance • Data analysis • - Enrich recorded evolution data E.g. evolution similarity metrics • Data visualization • multivariate : 10s attributes (Demo 6 attributes) • large data amount : 100s files,10s versions, 1000s lines • VTK – 2700 files x 100 versions ArgoUML – 4452 files x 80 versions SW Configuration Management≠SW evolution mining
SW Evolution Visualization Toolset data extraction version control management system CVSscan CVSgrab CVS Project evolutionvisualization File evolutionvisualization
Metric views System evolution at time ti Vertical layout – given by a sort criteria E.g. Creation time, Folder, Activity, Similarity Time V1 V2 V3 F1 F2 F3 Evolutionof file Fi F4 Files CVSgrab Color - encodes a file metric computed on a given version E.g. File type, Version author, Size increase, Release ID,Specific text, Activity
Horizontalmetric : Release ID Similar Different Vertical metric : similarity CVSgrab Example Color encodes version author Time Files
Time v1 v2 v3 v4 v5 CVSscan if self.bShowClusterColor: glBlendFunc(GL_ONE_MINUS_... glEnable(GL_BLEND) yPos = 0 bSwitch = True for i in lCushionMap: if bSwitch: cushions.drawColorCl.. else: cushions.drawColorClus… bSwitch = not bSwitch yPos = yPos + i glDisable(GL_BLEND) #cushion clusters glBlendFunc(GL_ZERO,GL_... glEnable(GL_BLEND) yPos = 0 bSwitch = True Color - encodes a line metric
CVSscan Line layout
Color encodes authors CVSscan Example Color encodes content
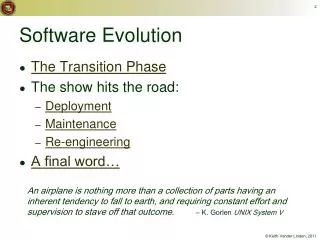
Conclusions • Toolset for visualization of software evolution : CVSgrab & CVSscan • Exploit source code history from CVS as main source for getting insight in the structure and development process • Complements existing reverse engineering and code navigation tools • Outlook: Improve the data analysis step, find mechanisms for annotation management, improve selection mechanisms, enhance the visualization with new features, extend the data acquisition sources and types… www.win.tue.nl/~lvoinea/VCN.html