Unified Modeling Language
Unified Modeling Language. Introduction Use case diagram Activity diagram Class diagram State machine diagram Other diagrams of interest UML in the software process . (Source: Fowler, M. UML Distilled, 3 rd edition. Addison-Wesley, 2004). 1. Introduction: Origins of UML.

Unified Modeling Language
E N D
Presentation Transcript
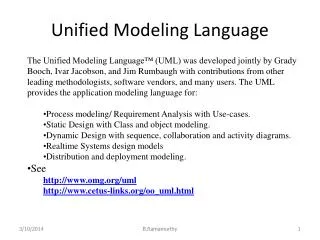
Unified Modeling Language Introduction Use case diagram Activity diagram Class diagram State machine diagram Other diagrams of interest UML in the software process (Source: Fowler, M. UML Distilled, 3rd edition. Addison-Wesley, 2004)
Origins of UML • In the 1980s, object-oriented programming moved from research labs into the real world • Smalltalk and C++ became popular languages and various people started thinking about object-oriented graphical design languages • Between 1988 and 1992, the key authors were Booch, Coad, Jacobson, Odell, Rumbaugh, Shlaer, Mellor, and Wirfs-Brock • Each author was informally leading a group of practitioners who liked those ideas • The same basic OO concepts would reappear in very different notations, causing confusion with clients • When Jim Rumbaugh left GE to join Grady Booch at Rational, an alliance was formed and a critical mass of market share occurred • In 1997, Rational released UML 1.0
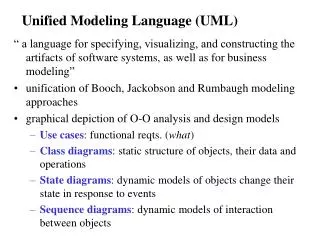
Origins of UML (continued) • Consists of a family of graphical notations that help in describing and designing software systems • Focuses particularly on software systems built using the object-oriented style • Controlled by the Object Management Group, which is an open consortium of companies • Comes from the unification of many OO graphical modeling languages that thrived in the 1980s and early 1990s
As a Sketch • Most common use of UML • Used to help communicate some aspect of a system and to better understand it • Used for both forward engineering (i.e., build diagrams before coding) and reverse engineering (i.e., build diagrams from existing code) • Strives to be informal and dynamic • Only emphasizes those classes, attributes, operations, and relationships that are of interest • More concerned with selective communication than complete specification
As a Blueprint • Goal is completeness • Is more definitive, while the sketch approach is more explorative • Used to describe a detailed design for a programmer to follow in writing source code • Notation should be sufficiently complete so that a programmer can follow it in a straightforward manner • Can be used by a designer to develop blueprint-level models that show interfaces of subsystems or classes • Developers then work out the implementation details • As a reversed engineered product, diagrams convey detailed information about the source code that is easier for developers to understand
As a Programming Language • Specifies the complete system in UML so that code can be automatically generated • Looks at UML from a software perspective rather than a conceptual perspective which concentrates on the domain of study • Diagrams are compiled directly into executable code so that the UML becomes the source code • Challenge is making it more productive to use UML rather than some another programming language • Another concern is how to model behavioral logic • Done with interaction diagrams, state diagrams, and activity diagrams
Comparing and ContrastingWays of Using UML • UML sketches are useful with both forward and reverse engineering and in both conceptual and software perspectives • Detailed forward engineering blueprints are difficult to do well and slow down the development effort • Actual implementation of interfaces will reveal the needs for changes • The value of reversed engineered blueprints depends on the CASE tool • A dynamic browser would be very helpful; a thick document wastes time and resources • UML as a programming language will probably never see significant usage • Graphical forms have not shown to be more productive in writing code than textual code for most programming tasks
Types of UML Diagrams (more on next slide)
Types of UML Diagrams (continued) (*) Denotes diagrams that we will use in this course
Classification of Diagram Types Class Diagram Component Diagram Composite Structure Diagram Structure Diagram Deployment Diagram Object Diagram Package Diagram Diagram Sequence Diagram Use Case Diagram Communication Diagram Behavior Diagram Activity Diagram Interaction Overview Diagram Interaction Diagram State Machine Diagram Timing Diagram
Use Case Diagram • Use cases serve as a technique for capturing the functional requirements of a system • Describes the typical interactions between the users of a system and the system itself, providing a narrative of how a system is used • A use case consists of a set of one or more scenarios tied together by a common user goal • A scenario is a sequence of steps describing an interaction between a user and a system; some scenarios describe successful interaction; others describe failure or errors • Users are referred to as actors; an actor is a role that carries out a use case • An actor need not always be a person; it can also be an external system that is either automated or manual
Use Case Diagram (continued) • A use case diagram is like a graphical table of contents of the use cases for a system • It shows the use cases, the actors, and the relationships between them • Use cases represent an external view of the system; consequently, they have no correlation to the classes in the system • They can serve as a starting point for writing software validation test cases
Example Use Case Diagram Make automated menu selections Expert Menu System Order food and drink Cook Notify customer that food and drink are ready Customer Pay for food and drink Payment System
Activity Diagram • Serves as a technique to describe procedural logic, business process logic, and work flow • Is similar to a flowchart except that it can also show parallel behavior • States the essential sequencing rules to follow, thereby allowing concurrent algorithms to be used • Consequently, an activity diagram allows whoever is doing the process to choose the order in which to do certain things • Can be used to describe the actions in a use case
Example Activity Diagram Set counter = positive n Set accumulator = initial value F n > 1 T Set accumulator = accumulator * n Set n = n - 1 (n mod 5) == 0 F T Display accumulator value Return accumulator value
Name Attributes Operations Class Diagram • Describes the types of objects in the system and the various kinds of static relationships that exist among them • Also shows the properties and operations of a class and the constraints that apply to the way objects are connected • A class box has three parts: • Name of the class • Attributes of the class • Operations of the class • Properties represent structural features of a class and consist of attributes and associations
Attribute visibility name: type multiplicity = default {property-string} • Example+ criticalMsg: String [1] = "Error message" {readonly} • Syntax • Visibility marker: public (+) or private (-) • Name: name of the attribute in the programming language • Type: Type of the attribute in the programming language • Multiplicity: how many objects fill the property • Default: Default value of the attribute at instantiation • {property-string}: additional properties of the attribute • Describes a property as a line of text within the class box • Used for representing value types
Source Target Association • Represented by a solid line between two classes directed from the source class to the target class • Used for representing (i.e., pointing to) object types • The name of the association goes at the target end of the association together • The target end of the association links to the class that is the type of the property • Multiplicities can be shown at both ends but are usually at the target end • Arrows may be bidirectional 1..n Name
Source Target Aggregation and Composition • Aggregation and composition are sometimes viewed as special types of associations and have their own UML symbol of a diamond at the source end of a line • Aggregation is a part-of relationship • Composition is more restrictive than aggregation • The diamond is filled in (i.e. shaded) • The part pointed to does not continue to exist without the whole 1..n Name
Operation visibility name (parameter-list) : return-type {property-string} • Example: + computeTotal (account: Account) : float • Syntax • Visibility marker: public (+) or private (-) • Name: name of the operation in the programming language • Parameter-list: list of parameters passed to the operation • Syntax: direction name :type = default-value • Direction is (in), (out), or (inout); default is (in) • Return-type: Type of the return value if there is one • {property-string}: additional properties of the operation • Portrays actions that a class knows to carry out • Corresponds to the methods of a class • Operations may be queries or modifiers; modifiers change the state of any object • Set and get operations are implied and therefore not shown
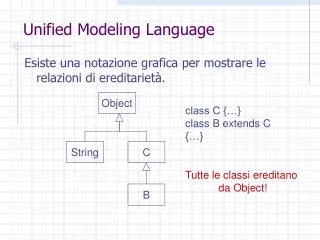
Super class Subclass Subclass Generalization • Portrays inheritance between a super class and a subclass • Is represented by a line with a triangle at the target end as shown below
Class Class Dependency • A dependency exists between two elements if changes to the definition of one element (i.e., the source or supplier) may cause changes to the other element (i.e., the client) • Examples • One class sends a message to another class • One class mentions another as a parameter to an operation • Once a dependency is created, if a class changes its interface, any message sent to that class may no longer be valid • A general rule is to minimize dependencies and be wary of cycles
Accounts Payable Account Production Manager Auditor Record Keeper Report Generator Transaction Processor Accountant Accounts Receivable InputVerifier Error Log Input Handler Local File Handler Remote File Handler Account List Example Class Diagram 1..n
When to Use Class Diagrams • Class diagrams are the backbone of UML and are the most used diagrams • Normally use only a subset of the notations available: class box, attributes, operations, association, aggregation, and generalization • Class diagrams only model software structure; consequently, it is easy to get too focused on class diagrams and ignore behavior • Use a state diagram to model the behavior of a class • Use a sequence diagram to model interactions (i.e., behavior) among objects of various classes
State Machine Diagram • Commonly called a state diagram • A state diagram describes the behavior of a system • In object-oriented technology, a state diagram shows the lifetime behavior of a single object • A state diagram captures the behavior of a state across several use cases • A state diagram consists of states and transitions • Note that a state diagram is NOT a set of processes connected by lines representing data input and output • A state is characterized by the current values of an object's attributes and its name reflects some ongoing activity or state • A transition indicates a movement from one state to another because an event has occurred; this transition changes one or more attribute values of the class
Transition trigger-signature [guard]/activity • Syntax • Trigger-signature: a single event that triggers a potential change of state • Guard: a Boolean condition that must be true for the transition to be taken • Activity: some behavior that is executed during the transition • All three parts of the transition label are optional • A missing guard means the transition is taken every time the event occurs • A missing activity indicates that nothing extra is done during the transition • A missing trigger-signature is rare; this means the transition is immediately taken and usually occurs in activity states • When an event occurs in a state, each corresponding transition out of the state must be unique • Multiple transitions with the same event must have guards on them that are mutually exclusive; otherwise its non-deterministic • If an event occurs for which there is no transition labeled, then the event is ignored in that state
Activity State • In some states, an object is inactive as it waits for the next event before it does something • In an activity state, the object is doing some ongoing work • The work may take a finite amount of time • A transition from the state cannot occur until the work is done • This is represented by "do/ activity" notation in the state box
Example State Diagram push [n – 2 < max] pop / return error push Empty Stack Partially Filled Stack pop [n > 1] pop [n == 1] pop [n == max] push [n - 1 == max] Full Stack push [n >= max] / set n to max; return error
Three Ways to Implement a State Diagram in Source Code • A double-nested switch statement • Each case label in a switch has its own internal switch statement • The case labels of the external switch are various states • The case labels of each internal switch are events • Guards are implemented as Boolean conditions • A state table with columns for source state, target state, event, guard, and activity • The state pattern, which creates a hierarchy of state classes to handle behavior of the states
Sequence Diagram • Captures the behavior of a single scenario in a use case • Shows a number of example objects and messages that are passed between those objects within the use case • The columns of the diagram represent each object involved in the use case • The life time of an object progresses from the top of the diagram to the bottom • Clearly illustrates the calls between participants and the sequence of those calls • Gives a good picture about which participants are doing which processing
Sequence Diagram (continued) • Can exhibit centralized control or distributed control • In centralized control, one participant does all of the processing • In distributed control, processing is split among many participants • Distributed control gives more opportunities for using polymorphism rather than using conditional logic • Use a sequence diagram when you want to look at the behavior of several objects within a single use case • When not to use a sequence diagram • If you want to look at the behavior of a single object across many use cases, use a state diagram • If you want to look at the behavior of several objects across many scenarios, use an activity diagram
Object Diagram • Represents a snapshot of the objects in a system at a point in time • Shows instances rather than classes, therefore it is sometimes called an instance diagram • When to use object diagrams • To show examples of objects connected together based on a specific multiplicity number • To show instances with values for their attributes
Package Diagram • Used to take any construct in UML and group its elements together into higher-level units • Used most often to group classes • Corresponds to the package concept in Java • Represented by a tabbed folder, where the tab contains the package name • Can show dependencies between packages • The more dependencies coming into a package, the more stable its interface needs to be
Deployment Diagram • Shows a system's physical layout, revealing which pieces of software run on which computer platforms • Uses rectangles to represent nodes and lines to represent communication paths between nodes • Nodes contain artifacts, which are the physical manifestations of software (i.e., executable and data files) • Listing an artifact in a node shows that the artifact is deployed to that node in the running system • Artifacts can be shown either as class boxes or by just listing the name in the node • Communication paths can be labeled based on the protocols that they use • Can be used as a configuration management tool to show an "as is" system architecture and a proposed "to be" system architecture for an organization
Fitting UML into Software Requirements Analysis • A use case diagram helps describe how people interact with the system • An activity diagram shows the context for use cases and also the details of how a complicated use case works • A class diagram drawn from the conceptual perspective is a good way of building up a rigorous vocabulary of the domain • It also shows the attributes and operations of interest in domain classes and the relationships among the classes • A state diagram shows the various states of a domain class and events that change that state
Fitting UML into Software Design • A class diagram drawn from the software perspective can show design classes, their attributes and operations, and their relationships with the domain classes • A sequence diagram helps to combine use cases in order to see what happens in the software • A package diagram shows the large-scale organization of the software • A state diagram shows the various states of a design object and events that change that state • A deployment diagram shows the physical layout of the software
Fitting UML into Software Documentation • Complements the written documentation and in some instances can replace it • Captures the outcome of the requirements analysis and design activities in a graphical format • Supplies a software maintainer with an overall understanding of a system • Provides a good logical roadmap of the system layout • Describes the various states in which a system may exist • Details complex algorithms in a more understandable form • Shows how multiple objects collaborate in the system