Download
1 / 14
140 likes | 238 Vues
Study on robust monthly CO emissions for 2006–2010 in South America using TM5-4D-Var with data from MOPITT and NOAA, emphasizing the need for bias correction for accurate emission estimates.

E N D
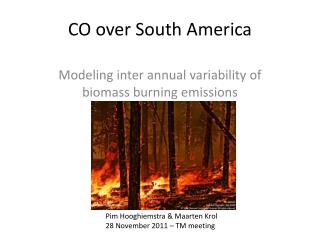
CO over South America Modeling inter annual variability of biomass burning emissions PimHooghiemstra & Maarten Krol 28 November 2011 – TM meeting
Motivation • Inter annual variability is observed in MOPITT columns over the Amazon region.
Goal • Robust monthly total CO emissions on high resolution for 2006 – 2010 over South America • Using TM5-4D-Var with 1ox1o zoom over South America • Prior from EDGARv4.1, GFED3.1, TM4-Crete • MOPITT columns / NOAA surface observations
Prior simulation vs observations • Emissions seem too low a priori (large region) • Over main BB regions, prior is too high in 2007 and 2010
Posterior fit with MOPITT • 4D-Var system brings model simulation close to observations. Fit is very good for large regions, a bit less for small regions.
Emissions 1ox1oregion • Large variability in emissions from year to year • Emissions increase for all months
Spatial patterns • 2007 & 2010: Emissions go down for deforestation regions Brazil • Other years, emissions increase (both BB and other sources)
Validation with NOAA Much too high => assimilate NOAA obsalso
Bias correction • A bias correction is needed to fit NOAA and MOPITT
Fit with data • Fit with NOAA improves greatly! • Fit with MOPITT remains good!
Effect on inferred emissions • Effect is only small
Sensitivity studies • Emission estimates are robust • Using GFED3-2009 for 2010 makes a large difference • NOAA only inversion yields too high biomass burning emissions in September and too low background emissions
Conclusions (1) • Robust IAV in BB emissions: Peak month emissions vary from 28 Tg CO in 2009 to 67 Tg CO in 2007. • BB emissions of GFED3.1 are too high in main deforestation regions in Brazil in 2007 & 2010. In other years, GFED3.1 seems a bit too low.Remark: difficult to quantify, we only optimize total. What about errors in the model?
Conclusions (2) • Inferred emissions sensitive to total prior BB emission. • Bias correction is necessary to fit both MOPITT & NOAA observations. No significant difference in optimized emissions and fit with MOPITT, fit with NOAA improves significantly.