Download
1 / 35
360 likes | 650 Vues
Geography, economic growth and convergence. geography matters recall core-periphery models recall geography and the Industrial Revolution (coal basins) new economic geography : c an location alone explain growth and convergence?. Geography, economic growth and convergence.

E N D
Geography, economic growth and convergence • geography matters • recall core-periphery models • recall geography and the Industrial Revolution (coal basins) • new economic geography: can location alone explain growth and convergence?
Geography, economic growth and convergence Towards a geography of convergence recall: a three-phased trend in the location of production 1: the rise of UK and western Europe, fall of China, and India (1800-1880) 2: North America takes the lead (1880-1980) 3: the “asian tigers” fight back (1980-1998)
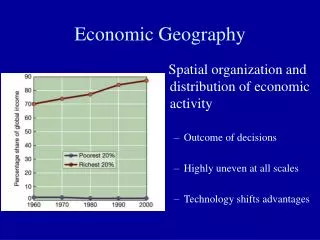
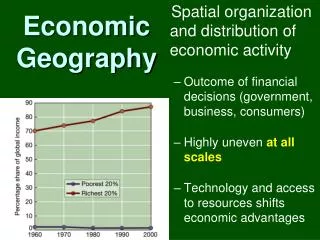
Geography, economic growth and convergence economic and demographic trends 1820: a balanced geographical distribution 1913: concentration in Europe and North America 1998: signs of a new spatial pattern (selective dispersion) the overall picture: selective geographical convergence
A brief history of transports and communications trade costs: geographical distance vs economic distance qualitative changes in transports before 1850: innovations do not affect volumes of trade 1830-50: the Revolution in transports and communication begins
A brief history of transports and communications Ships and canals from the “Comet” (1812) to the first steamship Atlantic cross over (1838) 1860-1880 steamships take-over sailships 1869 Suez Canal opens 1914 Panama Canal opens
A brief history of transports and communications Trains and railroads 1825: first locomotive 1830: the Manchester-Liverpool line 1850-70: the “golden age”; railroad extension increase by 5 times 1880-1914: international development Revolution in communications: telegraph (1858-1866), telephone (1880-1900)
A brief history of transports and communications The impact on transport costs in 20th c. a substantial decline: in 1910 sea shipping prices are about 1/3 than in 1830 1800-1910: a drop in inland transport prices of around 90%
A brief history of transports and communications interwar-years: transport costs remain stable or slightly increase after WW 2, a declining trend starts again: 1990 prices are about 50% less than in 1910 yet, it is not comparable with the ongoing drop in commodity prices
A brief history of transports and communications relevant changes however occur: air transport: 1960s-1990s the ratio of air to ocean shipments grows about 10 times containers and logistics 1960s-1990s the speed of ocean shippingdoubles Information and Communication Technologies (ICT)
A brief history of transports and communications it is likely that transport costs fall much more since the 1960s even today distance is not “dead” volumes: about 40-50% less at a distance of 2,000 km, and 70-80% less at a distance of 4,000 km
A brief history of transports and communications back to trade costs = transport + tariffs foreign trade-World GDP ratio as a measure of economic distance the impact on location: before 1820: dispersion 1820-1913: concentration 1945-1998: new geographies of location are possible
Geography and growth: a model in traditional models of economic growth, size does not matter ... while, in new economic geography size matters; assuming: (1) a relation between returns and scale (2) “cumulative causality” plus, aggregation influences: (3) human capital (4) skill transmission
Geography and growth: a model the basic “History of the world” model: two countries (N and S) two sectors (agriculture and industry) same wages and no migration and the variable of trade costs
Geography and growth: a model high trade cost: N specializes in industry (= higher wages) as trade cost fall: industries move to S (= wages tend to converge) equilibrium = “death of distance” lesson: the decrease in trade costs explains concentration/dispersion
Geography and growth: a model the core is “cumulative causality”, a circular process: (a) firms/workers move creating a hierarchy: big and small markets (b) imperfect competition favours scale and location advantages for big markets (c) increasing returns provide higher wages and profits for big markets (d) big markets attract factor labour and capital
Geography and growth: a model furthermore: (a) innovation of transport technology is the trigger of such process in 19th c. (b) only a further decline of trade costs breaks the “circle” (c) ... allowing firms/workforce to move to lower-cost regions (d) and the “circle” can start once again in a new area
Case 1: North America testing the model on late 20th c. growth in the USA 1860-1914 from agricultural economy to world industrial leader why USA? A comparison with Latin American countries Argentina does not keep USA pace standard explanation: institutions and technology
Case 1: North America a complex variant of the model: Europe, USA, rest of the World it highlights the role of: USA protection policies USA open-access to work-force migration transport revolution arrives just in time
Case 2: Urbanization globalization inside a country: moving to the city 1850-1910: migration = 34 millions urbanization = 145 millions industrialization determines city population increase: 1800-1914: from 24 to 281 cities with over 100,000 inhabitants
Case 2: Urbanization nothing similar occurs in non-industrialized regions
Case 2: Urbanization if transport innovation overcomes market-scale bottlenecks, city population may increase two models: size related to transport costs, fosters specialization (wage-maximizing city) agglomeration is in itself beneficial, unspecialized cities
Case 3: East Asia evidence of the East Asian “miracle” of the late 20th century a timeline: (1) Japan; (2) Asian “tigers”; (3) China mainstream story: institutional change as the key of Asian success including geography in the explanation: selective convergence
Case 3: East Asia East Asian pattern: a chain of one-country-at-a-time converging 1980s: Japan’s high income allows investments in other low-wage E. Asian countries declining intra-Asian trade costs trigger delocation in Taiwan, S. Korea, etc. 1990s Asian “tigers” converge 2000s: it is China’s turn to converge
Case 3: East Asia fitting the narrative in the model (1) only one industrialized economy (2) high wages plus declining trade costs favour transfer of industries (3) yet, industrialization is unstable, only one country converges while the others miss this turn (4) growth in demand re-starts the cycle
ICTs and the death of distance? the impact of new ICTs on location successful examples of dispersion, and limits: a minor share of World GDP is involved likely automation of sectors now using low-wage labour but ICTs can favour concentration proximity is at time profitable
Concluding remarks beware of single-side explanations, though geography is important technology and human capital can move as well where do Continental Europe, and India fit in the one-country-at-a-time model?