Download
1 / 32
320 likes | 383 Vues
The Renewable Fuels Situation Agricultural Lender’s Conference 2006. Mike Woolverton Kansas State University mikewool@agecon.ksu.edu. Energy: Non-petroleum Sources. Wind Solar Hydro Hydrogen cells Nuclear Bio-fuels. Years of Oil Remaining.

E N D
The Renewable Fuels SituationAgricultural Lender’s Conference 2006 Mike Woolverton Kansas State University mikewool@agecon.ksu.edu
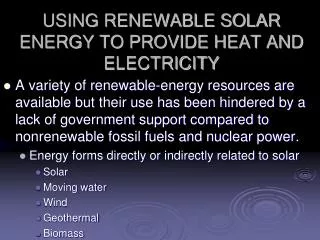
Energy: Non-petroleum Sources • Wind • Solar • Hydro • Hydrogen cells • Nuclear • Bio-fuels
Years of Oil Remaining Total Reserves 1,277,702,000,000 50years Usage Rate 25,000,000,000 (Barrels) Source: en.wikipedia.org/wiki/Fossil_fuel
U.S. Oil Import Suppliers • Canada • Mexico • Saudi Arabia (OPEC) • Venezuela (OPEC) • Nigeria (OPEC) • Iraq • Angola • Algeria (OPEC) • Russia • Ecuador Source: Energy Information Administration
Estimated Extraction Cost per Barrel of Oil • U.S. $10 to $12 • Arabian Peninsula $1
The United States and Oil • Use 20 million barrels per day • Produce 6 million barrels per day • Oil usage increases 2% per year but the economy has been growing at 3.3% per year • Usage in barrels per dollar of GNP is one-half of the 1947 level • Cost per year to import oil - $175 to $200 billion
What it will take to replace imports? The U.S. uses 140 billion gallons of gasoline and 41 billion gallons of diesel fuel per year made from oil of which 65% is imported. To replace the imported gasoline with ethanol would require 33.6 billion bushels of corn. This year’s production – 10.9 billion bushels. To replace the diesel with soy-diesel would require 26.9 billion bushels of soybeans. This years projected production – 3.2 billion bushels.
Renewable Fuels Drivers • High oil price • Instability in oil exporting regions of the world • Flow of dollars out of the United States • Energy Policy Act of 2005 • Mandates and tax reductions • Phase out of MTBE • Good Returns on Investments
Bio-refining Assumptions • Petroleum will remain relatively expensive • Raw materials will be relatively inexpensive • Raw materials can be replenished each year (sustainable)
Net Energy Balance ProductEnergy Out/Energy In Gasoline .81 Ethanol from grain 1.35 Ethanol from cellulose 4.17 Diesel .91 Bio-diesel 3.24 Sources: Argonne National Laboratory and OECD International Energy Agency
Ethanol Industry at a Glance • Number of operating ethanol plants: 105 • Plants under construction and expanding: 48 • Announced plants: 100+* • 2005 production, 3.9 billion gallons per year (BGPY) • Current production capacity: 5.0 BGPY • Projected production capacity, 7.9 BGPY by early 2007 • Size: Newer plants 100 MGPY • Process: wet or dry • Daily water usage – 1.5 million gallons • Feedstock percentage: Corn 97 Sorghum 2 Other 1
Kansas Ethanol Industry • Number of operating plants: 8 – 215 MGPY • Plants under construction: 4 – 225 MGPY • Plants in the planning stages: 14 – 500 MGPY • Corn usage: 440 MGPY – 163 mil. Bu. (25%)1 940 MGPY – 348 mil. Bu. (53%)1 1 Percentage of the 2005 Kansas corn and grain sorghum crops.
Ethanol Plant Economics • Cost to build a 100 MGPY plant - $140 million • Will purchase about 37 million bushels of corn (Corn from 240,000 acres) • Natural gas expense - $16.5 million • Payroll expense about $2 million • Distiller’s Dried Grains income about $25 million • CO2 income about $4 million (314,500 tons) • B.E. ethanol price $1.20 to $1.30 per gallon when corn is $2.50 per bu. • Goal 30% R.O.I.
Corn/Ethanol Projections, U.S. 06/07 07/08 Corn Acres 78.6 mil. 82 mil. Corn Production 10.9 bil. Bu. 12.3 bil. Bu. Corn Exports 2.25 bil. Bu. 2.0 bil. Bu. Corn for Ethanol 2.15 bil. Bu. 3.4 bil. Bu. Ethanol Production 5.8 bil. Gal. 8.6 bil. Gal. DDG Production 18.3 mil. T. 28.9 mil. T. (Thirty to 40 percent will replace corn in rations. Sixty to 70% will replace soybean meal.) Source: Paul Smolen, AgriNetwork Management and Mike Woolverton, KSU.
Dangers Ahead for Ethanol • Over expansion – On-line capacity in 2007 is expected to be 7.9 billon gallons • Competition from iso-octane and iso-octene oxygenates made in converted MTBE plants • Competition from imports (tariff $.54/gal.) • Food or fuel debate • Drop in the price of ethanol
Cost of Fermentable Sugar per Gallon of Ethanol • Sugarcane $.30 • Corn .91 • Sugarbeets .95
The Bio-diesel Formula 100 gallons of veg. oil or animal fats +10 gallons of methanol = 100 gallons of bio-diesel +10 gallons of glycerol
Advantages of Bio-diesel • No sulfur and less carbon emissions • Higher cetane rating – better mileage • Superior lubricity One disadvantage: Bio-diesel requires an additive to prevent jelling at low temperatures
Diesel Fuel (Wholesale per gallon) $1.7783 Soybean oil ($ .2493 per pound) $1.87 Glycerin credit = Methanol cost 0 Net Margin $-.09 Bio-diesel Processing Margin per Gallon, Oct 17th 2006
U.S. Soy-diesel Production • Currently 65 plants in U.S. • Total capacity 365 mg – ave. size 7.45 mil. • Output 2005 – 75 mg of biodiesel Why? • Plants under 10 mg batch process using waste fats and oils • Much of output has been going to soap and shampoo rather than biodiesel
U.S. Soy-diesel Production • 58 plants expanding or under construction projected capacity 713 mil. gal. • Many of the new plants - 30 mil. gal. (Requires the oil from 400,000 A. soybeans.) • Continuous processing using multiple feedstocks of vegetable oil
Vegetable Oil Yields Corn 18 Gal./A. Soybeans 66 Sunflowers 102 Rapeseed 127 Castor Beans 151 Oil Palm 635
World Production of Fats and Oils, 2003/04, MMT Vegetable Tropical Soy 30.1 Palm 28.7 Rape 14.1 Palm Kernel 3.5 Sun 9.3 Coconut 3.3 Peanut 5.0 Cotton 3.8 Olive 2.8 Source: USDA, Agricultural Statistics, 2005.
Soybean/Bio-diesel Projections, U.S. 06/07 07/08 Soybean Acres 75.6 73.0 Soybean Production 3.2 bil. bu. 3.0 bil. bu. Soybean Exports 1.1 bil bu. 900 mil. bu. Soybean Oil for BD 2.35 bil lbs. 4.65 bil. lbs. Bio-diesel Production 400 mil. g. 730 mil. g. (330 from SBO) (600 from SBO) Soybean Meal Exports 7.5 mil. T. 11 mil. T. Source: Paul Smolen, AgriNetwork Management and Mike Woolverton, KSU
Bio-diesel Conclusions • The industry is ramping up production capacity. • Increased demand for vegetable oil will drive price up. • Bio-diesel production will be constrained by the supply and price of vegetable oil. • Soybean meal will become the by-product and increased supply will cause price to fall. • U.S. soybean meal exports will increase. • The price of petrol-diesel will determine the economics of bio-diesel.
Alternative Technologies • Cellulosic Ethanol • Bio-diesel from Algae Oil