Download
1 / 77
790 likes | 934 Vues
Renewable Energy Professor Mohammed Zeki Khedher Lecture 1. World population. Fossil Fuels – Oil Refinery Pasadena - Texas. Standard Large Power Plants Provide 1 Giga-watt of electric power and releases 2 Giga-watts of thermal power as waste heat. An efficiency averaging around 30%.

E N D
Fossil Fuels – Oil Refinery Pasadena - Texas Standard Large Power Plants Provide 1 Giga-watt of electric power and releases 2 Giga-watts of thermal power as waste heat. An efficiency averaging around 30%. • 9000 tons of coal a day • 40,000 barrels a day or one tanker a week of oil • -generates about 5.3 x 10^9 kwh/year • -powers a city of a million people
total world production in 1996 of • petroleum is 62,239e3 barrels / day • an average well in the US produces • only 11 barrels / day • In Saudi Arabia an average well • produces 9600 barrels /day Oil Drilling Platform Cook Inlet, Alaska
Fuel Efficiency Over Time
Renewable EnergyProfessor Mohammed ZekiKhedherLecture 2ReferenceGlobal Status ReportRenewable Energy Policy Network for the 21 century
Renewable energy added about half • Estimated new electric power added 194GW • Estimated Renewable energy world wide 1320GW almost 8% over 2009
Renewable EnergyProfessor Mohammed ZekiKhedherLecture 3References:Global Status ReportRenewable Energy Policy Network for the 21 century & Key World Energy Statistics
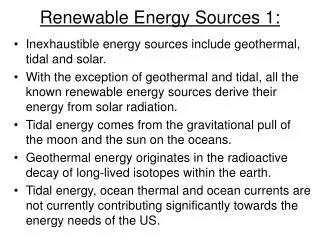
Renewable Energy Sources • Solar photovoltaics • Solar thermal power • Passive solar air and water heating • Wind • Hydropower • Biomass • Ocean energy • Geothermal • Waste to Energy
Hydroelectric Power • Conversion from potential energy of • water to electric energy is at 80 – 90% • efficiency -Hydroelectric projects in the United States have rated capacities from 950 – 6480 MW • The use of Water Power is much • greater in some other countries. • Norway obtains 99% of its electricity • from water power. Nepal, Brazil, and • New Zealand are close seconds. Water generated - Hydroelectric Shasta Dam In California
Other Energy Considerations • Solar Power – uses the sun energy to either boil water or directly converts • solar energy to electrical energy • Ocean Thermal Energy Conversion – uses temperature differences • between different depths of ocean water to drive a heat engine. Working • fluid is ammonia which is gas at room temperature. -Biomass Energy: Municipal Solid Waste – burning wastes to drive heat engines • Geothermal Energy – based on naturally occurring heat in the Earth in the • Earth due to radioactive decay • Tidal Energy – uses the gravitational pull of the moon on our oceans to • drive turbines
FORECASTED RENEWABLE COSTS 4030 20 10 0 100 80 60 40 20 0 PV Wind cents / kWh 1980 1990 2000 2010 2020 1980 1990 2000 2010 2020 70 60 50 40 30 20 100 1512 9 6 30 10 8 6 4 20 Solar thermal Biomass Geothermal cents / kWh 1980 1990 2000 2010 2020 1980 1990 2000 2010 2020 1980 1990 2000 2010 2020 all costs are levelized in constant year 2000 dollars Source: NREL Energy Analysis Office (www.nrel.gov/analysis/docs/cost_curves_2002.ppt)
Nuclear Energy Problems and Concerns • In normal operations a nuclear reactor produces some environmental • emissions. E.g.: escape of radioactive fission products through cracks and • diffusion, radioactive H3 in small amounts in discharged water • Core meltdown are possible, but unlikely due to negative feedback and • shutdown systems • Even after shutdown there is 7% of normal power generation still in the • reactor fuel rods. This may be sufficient enough to melt core and destroy • the reactor, if cooling water is not supplied • A study entitled “Severe Accident Risks: An Assessment for Five US • Nuclear Power Plants” conducted by NRC in 1990, shows that for all the • 109 reactors now operating in the United States over a 30 year lifetime • there is about a 1% chance of a large release due to internal events.
Problems With Wind Power • Wind variability must be overcome by system design - Basic energy Storage Enviornmental Concerns - Differences in pressure gradients around wind turbines affect birds • Noise from the turbines affects people and animals • Eyesore, the appearance of mile after mile of wind machines with • transmission lines is of concern to the public