
0cM
E N D
Presentation Transcript
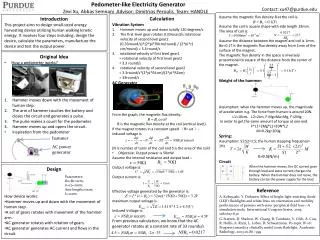
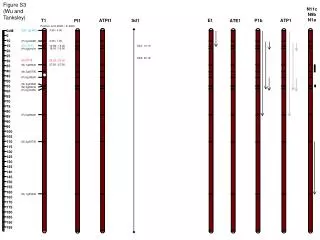
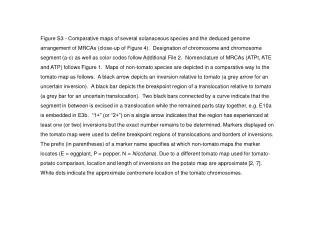
Figure S3 - Comparative maps of several solanaceous species and the deduced genome arrangement of MRCAs (close-up of Figure 4). Designation of chromosome and chromosome segment (a-c) as well as color codes follow Additional File 2. Nomenclature of MRCAs (ATPt, ATE and ATP) follows Figure 1. Maps of non-tomato species are depicted in a comparative way to the tomato map as follows. A black arrow depicts an inversion relative to tomato (a grey arrow for an uncertain inversion). A black bar depicts the breakpoint region of a translocation relative to tomato (a grey bar for an uncertain translocation). Two black bars connected by a curve indicate that the segment in between is excised in a translocation while the remained parts stay together, e.g. E10a is embedded in E3b. “1+” (or “2+”) on a single arrow indicates that the region has experienced at least one (or two) inversions but the exact number remains to be determined. Markers displayed on the tomato map were used to define breakpoint regions of translocations and borders of inversions. The prefix (in parentheses) of a marker name specifies at which non-tomato maps the marker locates (E = eggplant, P = pepper, N = Nicotiana). Due to a different tomato map used for tomato-potato comparison, location and length of inversions on the potato map are approximate [2, 7]. White dots indicate the approximate centromere location of the tomato chromosomes.
Figure S3 (Wu and Tanksley) N11c N9b N1a T1 E1 ATPt1 Pt1 ATE1 P1b ATP1 0cM (EP) 1g14810 5 10 (P) 3g12685 15 (E) CT197 (P) 5g51970 20 25 30 (N) 1g26940 35 40 (N) 3g06790 45 (P) 5g18590 50 (N) 3g23590 55 (N) 3g08030 (P) 5g13450 60 65 70 75 80 (P) 2g45620 85 90 95 100 105 110 (N) 2g38730 115 120 125 130 135 140 145 150 155 160 (N) 1g25260 165 170 175 180 185 190 195
Figure S3 continued (Wu and Tanksley) E2 P2 ATP2 ATE2 N2 Pt2 ATPt2 0cM T2 5 10 (P) 1g30540 15 20 (P) 5g44200 25 30 35 40 45 (E) TG554 50 55 (P) U223436 60 (P) 4g18060 65 (E) 3g56210 70 75 80 85 90 95 100 105 110 (EP) 2g04700 115 120 (E) CT9 125 130 135 140 145 (E) TG140 150 155 (E) CT59 160 (P) 4g37280
Figure S3 continued (Wu and Tanksley) P4a P3c E3a E3c N9c N3b ATE3 ATP3 Pt3 ATPt3 T3 0cM 5 10 (P) E492334 15 (P) 4g18230 20 25 30 35 (N) 1g61150 (P) TG132 40 45 (EP) TG517 50 55 2+ 60 (PN) 1g51160 65 (P) 3g63530 70 75 80 (E) 5g62390 85 90 95 100 105 110 115 120 125 130 135 140 145 150 155 160 165 170 175 180
Figure S3 continued (Wu and Tanksley) N4a N5b N4c P5a P12b P4b E11b E4b ATP4 Pt4 ATPt4 ATE4 0cM 5 10 T4 15 20 (E) GP180 25 30 35 40 (E) TG370 45 50 (PN) 4g25650 55 (P) 3g52155 (E) T0635 60 (P) 1g27385 65 (N) 5g37360 (E) 3g62940 70 (N) 3g54770 (P) 4g39660 75 (E) 4g39870 80 (P) 1g65230 (PN) 1g77250 85 (E) T0877 90 95 100 105 110 115 120 125
Figure S3 continued (Wu and Tanksley) E3b(E10a) E5a N10b N5a P11a P5b ATP5 T5 Pt5 ATPt5 ATE5 0cM (P) CT101 5 (E) 1g60440 10 15 (E) T0564 20 (E) 1g24340 25 30 35 40 (PN) 2g01110 45 50 55 60 65 (N) 1g26520 (N) 1g26670 70 (EP) 1g69420 (E) TG379 75 (P) 1g67325 80 (E) 1g67700 (EPN) 2g46580 85 90 95 (N) 5g05270 100 105 110 (N) 5g49510 115 120 125 130
Figure S3 continued (Wu and Tanksley) N3a N6b ATE6 E6 ATP6 P6 T6 Pt6 ATPt6 0cM 5 (E) CD14 10 (P) 2g30100 (E) 2g39690 15 (P) 4g01900 20 25 (N) 3g56040 30 (N) 4g27700 35 40 45 50 55 60 65 70 75 80 85 90 95 100 105 110 (E)TG482 (N) 4g28530 115 (EN) 1g20050
Figure S3 continued (Wu and Tanksley) 0cM 5 N11a N7a 10 15 E7 ATPt7 P7 Pt7 ATE7 ATP7 T7 20 25 30 35 40 45 (N) 2g06925 50 55 60 (N) 4g33250 65 70 75 80 85 90 95 100 105 110 115 120 (E) CT223 (E) 1g55670
Figure S3 continued (Wu and Tanksley) 0cM 5 P8 P1a N12a N8b 10 15 ATP8 ATE8 ATPt8 E8 Pt8 T8 20 25 30 (N) 4g31130 35 (P) 2g24390 40 45 50 (N) 1g20830 55 (N) 3g53920 60 (P) CT77 65 70 (N) 4g32770 75 80 85 90 95 100 105 110 115 120
Figure S3 continued (Wu and Tanksley) N7b N1b N9a 0cM P9a P3a 5 ATP9 ATE9 E9 Pt9 ATPt9 T9 10 15 20 (EP) 2g37240 25 30 35 40 45 50 (E) T0880 55 (P) 5g06130 60 65 70 (N) 4g12740 (P) 2g29210 75 (N) 3g63200 80 (PN)) 4g03200 85 90 (N) 1g04190 95 100 105 (N) 3g16840 110 115 (N) 3g24050 120 125
Figure S3 continued (Wu and Tanksley) E4a E10c N8a N10a ATE10 ATPt10 Pt10 P10 ATP10 0cM T10 5 10 (N) 3g13235 15 (E) TG230 20 25 30 35 (N) 4g03400 (E) T0637 40 (N) 2g46370 45 (E) 2g46340 (E) U217183 50 (N) 5g36210 (E) TG386 55 (E) CT217 60 (E) 3g08760 (E) TG280 65 (E) TG285 70 (P) 3g57270 75 80 85 90 (E) TG63 (EP) CD32
Figure S3 continued (Wu and Tanksley) N5c N4b N11b (N1c) 0cM 5 E11a E12b P12a P11b 10 ATP11 ATE11 Pt11 ATPt11 15 T11 20 25 30 35 40 45 50 55 60 65 (N) 3g52640 (E) CT182 70 (PN) 1g21690 75 80 (N) 3g17590 85 (E) TG47 90 (N) 5g12200 95 (P) 1g51350 100 (N) 2g28800 (P) 3g44890 105 (P) 3g44600 110 115 (E) TG46 1+ 120 (N) 3g53400 (N) 5g11810 125 (EP) TG36 (N) 5g25760 (N) 2g28490 (EP) 5g59960
Figure S3 continued (Wu and Tanksley) 0cM P9b P3b P12c 5 E10b(E12a) E5b N6a N12b 10 ATE12 Pt12 ATPt12 T12 ATP12 15 20 25 30 35 (E) 4g03280 40 (E) 4g28830 45 (E) TG68 50 55 60 65 (E) 5g57970 70 (EP) 4g11120 (E) CT99 75 (P) 5g42740 80 (N) 3g13180 (E) TG283 85 (P) 4g18593 (P) 3g24490 90 (N) 3g16290 95 (PN) 1g17410 100 105 (P) T0801 110 115 (N) 4g16580 120 125