Download
1 / 33
330 likes | 535 Vues
Richard Grumm National Weather Service State College PA. Standardized anomalies As a means to identify high impact weather events. Standardized anomalies and probabilities of standardized anomalies aid in producing forecasts of significant weather events in these examples heavy rainfall

E N D
Richard Grumm National Weather Service State College PA Standardized anomaliesAs a means to identify high impact weather events
Standardized anomalies and probabilities of standardized anomalies aid in producing forecasts of significant weather events in these examples heavy rainfall • This is of value in determining the threat and assigning confidence in the threat • We can leverage this information • Communicate in decision making • Provide confidence in the event type • And the general area to be impacted Introduction
Communicating concisely the important points • What are the most likely outcomes and the most likely impacts. • Too often we drop the ball here, mired in details • The science or nuts-bolts • Too often we get lost in these details and miss the point • Okay, some nuts and bolts Two parts of the process
We need several things: • The mean value (C )of each field (u,v,h,PW,MSLP) • The standard deviation of each fields (s) • And the instantaneous value of the field (F) • Thus standardized value is simply • SD = (currentValue - climateValue)/s SD = (F – C)/ s Defining standardized anomalies
We can compute this from • Re-analysis data for past big/historic events • A single model • An ensemble mean • Power from ensembles • Probabilities of key areas of large SD • Relate back to fields/parameters associated with critical high impact weather • Providing us a Threat Assessment. The real power is in ensembles to get probabilities SD = (F – C)/ s
Historic floods like New England March 2010 Grand Ole Memphis May 2010 to string you along some more The devastating Pakistani floods of Jul-Aug 2010. September record rain eastern USA Would a probability of precipitation relative to climatology be useful? Standardized anomalies Recent floods
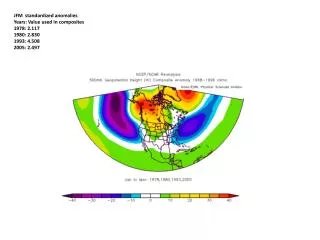
Figure . As in Figure 4 except valid 0000 UTC 28-30 July 2010. July 2010 Pakistani floods Composite anomalies For 28-30 July 2010
The patterns are simple repeatable and thus of value to us. • The critical thing is to Leverage this • With probabilities of key fields to attach confidence in a significant event • Tie in QPF probabilities in events like this • To confidently anticipate an meteorologically and climatologically significant event. Threats: probabilities and patterns
Moscow record heat-July 2010 • Large height and 850 hPa temperature anomalies • Plume of high PW air about the ridge • Anomalies signal • Historic Mid-western Storm October 2010 Other quick examples
Historic Mid-western Storm October 2010 • We can define anomalies to get at • Potential record low pressure • High winds about the deep cyclone • And the surge of moisture. • Show me the cold or is it the “money” Other quick examples-II
Standardized anomalies and probabilities facilitate quick identification of significant weather events • We need to leverage the probabilities • Make better threat assessments graphics, provide confidence and probabilistic decision inputs to users • Conveying the information is as important recognizing the threat. Review
The role of standardized anomalies in identifying the potential for high impact weather events is presented. Four historic rainfall events including the 30-31 March 2010 New England Floods, the 5 May 2010 Nashville Floods, the July 2010 Pakistani Floods and the 30 September 2010 Mid-Atlantic heavy rainfall event are presented using re-analysis data. In addition to these rainfall events, the East Coast Heat wave of July 2010 and the Great Russian heat wave of July-August 2010 are presented from a standardized anomaly perspective. Each event was associated with significant standardized anomalies in key parameters forecasters often use to identify such events. Quantifying the standardized anomalies facilitates quick assessment of the potential impact of these events. Two to 3 standard deviations in the precipitable water field combined with 3 to 4 standard deviations in the wind fields often aid in quickly identifying the potential for significant heavy rainfall events. Heat events are often characterized by 1 to 2 standard deviation above normal mid-tropospheric heights and 2 to 3 standard deviation above normal low to mid-level tropospheric temperatures. A new method of displaying ensemble data is presented. This display method uses the probability distribution function (PDF) of ensemble forecasts of key standardized anomaly fields. The PDF information can facilitate the quick identification of the potential for high impact events. For heavy rainfall events, these PDF data can be used to tie the potential high impact pattern back to the high probability forecasts of heavy rainfall. Key thesis of this talk