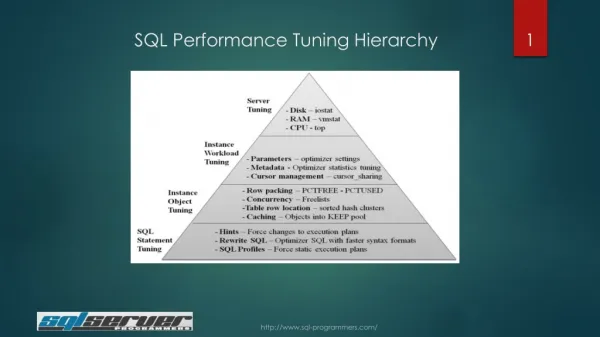
SVR301 - Performance Tuning with Windows HPC Server 2008
420 likes | 641 Vues
SVR301 - Performance Tuning with Windows HPC Server 2008. Xavier Pillons xpillons@microsoft.com Program Manager Microsoft Corporation. Agenda. Introduction Head Node Sizing SOA Performance Measuring performances Troubleshooting network MS-MPI tracing and tuning Minimizing OS Jitter

SVR301 - Performance Tuning with Windows HPC Server 2008
E N D
Presentation Transcript
SVR301 - Performance Tuning with Windows HPC Server 2008 Xavier Pillons xpillons@microsoft.com Program Manager Microsoft Corporation
Agenda • Introduction • Head Node Sizing • SOA Performance • Measuring performances • Troubleshooting network • MS-MPI tracing and tuning • Minimizing OS Jitter • Windows Server 2008 – Known issues • Questions
Introduction • How to size the Head Node for large clusters ? • SOA Performance Consideration • How to monitor performances on Windows ? • What to look for ? • How to tune the system ? • How to trace MPI ?
Top500 & Windows HPC Server Spring 2008, NCSA, #23 9472 cores, 68.5 TF, 77.7% September 2008, SSC, #10 30720 cores, 180.6 TF, 77.4% Spring 2008, Umea, #40 5376 cores, 46 TF, 85.5% Spring 2008, Aachen, #100 2096 cores, 18.8 TF, 76.5% Spring 2006, NCSA, #130 896 cores, 4.1 TF Winter 2005, Microsoft 4 procs, 9.46 GFlops Spring 2007, Microsoft, #1062048 cores, 9 TF, 58.8% Fall 2007, Microsoft, #1162048 cores, 11.8 TF, 77.1% 30% efficiencyimprovement Windows HPC Server 2008 Windows Compute Cluster 2003
Head Node Performance / Sizing • V2 Supports Much Larger Clusters Than V1 • Should be “comfortable” up through 500+ nodes • Requires some care and feeding of the head node • SQL Tuning • Transaction Log on Separate platter • Max Server Memory • Max Degree of Parallelism • Maintenance plans • Monitor and throttle compute node feeds
SOA Performance Sensitivity to message size
SOA Performance - Continued • Expect Reasonably Slow Session Startup • 5 – 20 seconds @ 1000 cores • Do Not use Server Side Throttling • WCF Quotas May need Extending • May set portSharingEnabled=false
Windows Performance Toolkit • Official performance analysis tools from Windows • Used to optimize Windows itself • Wide support range • Cross platform: Vista, Server 2008/R2, Win7 • Cross architecture: x86, x64, ia64 • Very low overhead – live capture on production systems • About 2.5% processor overhead for a sustained rate of 10,000 events/second on a 2GHz processor • The only tool that lets you correlate most of the fundamental system activity • All processes and threads, both user and kernel mode • DPCs and ISRs, thread scheduling, disk and file I/O, memory usage, graphics subsystem, etc. • Available externally: part of Server 2008 SDK • http://www.microsoft.com/whdc/system/sysperf/perftools.mspx
Using xperf • General machine health • xperf –on latency • What is running on the cluster over a 2 hour period • xperf –on proc_thread+loader • What exactly is causing all the hardfaults I see • xperf –on latency –stackwalkhardfault
DEMO xperf in action
Basic Troubleshooting • Know Expected Bandwidths and Latencies • Make sure drivers and firmware are up to date • Use the product diagnostics to confirm
Built-in Diagnostics • Mpipingpong • Can be launched through diagnostics UI • But limited in this context though • No network choice, no intermediate results • Better if run directly from the command line for power users • Features • Tournament mode, ring mode, serial mode • Output progress to xml, stderr, stdout • Test throughput / latency or both • Remember to run 1 rank per node
What can go wrong with ND • Switch / hardware issues • Use vstat or equivalent to diagnose • Classic binary search through nodes ( using linpack ) • Incorrectly seated slots, PCI bus issues • Remember to install the provider ( ndinstall –i ) • OpenSM issues • For large clusters ( 1000nodes+ ) run it on a dedicated machine • Disable IPv6 if necessary
Interpreting vstat hca_idx=0 uplink={BUS=PCI_E, SPEED=2.5 Gbps, WIDTH=x8, CAPS=2.5*x8} vendor_id=0x05ad vendor_part_id=0x6278 hw_ver=0xa0 fw_ver=0x400070258 node_guid=0005:ad00:000b:5e18 num_phys_ports=2 port=2 port_state=PORT_ACTIVE (4) Link_speed=2.5Gbps (1) link_width=4x (2) rate=10 Gbps port_phys_state=LINK_UP (5) active_speed=2.5 Gbps(1) sm_lid=0x0001 port_lid=0x0001 port_lmc=0x0 max_mtu=2048 (4) ConnectX requires PCI_E 2.0 Shows as 5Gbps speed 2.5 = SDR 5.0 = DDR 10.0 = QDR Less than 4x implies a bad cable Can detect DDR running as SDR
What can go wrong with GigE • Lack of kernel bypass has its flaws • Sensitivity to network filters: • Bfe, ipsec, firewalls, anti-virus • OS changes • Chimney offload – full tcp offload to nic • RSS - Interrupts can be received on any processor • Interrupt moderation – batches to reduce ISR / DPC time • Interactions can be unexpected • Netshinttcp show/set global • Nic specific for certain settings
MS-MPI Fine tuning • Lots of MPI parameters (use mpiexec –help3): • MPICH_PROGRESS_SPIN_LIMIT • 0 is adaptive, otherwise 1-64K • SHM / SOCK / ND eager limit • Switchover point for eager / rendezvous behaviour • ND ZCOPY threshold • Sets the switchover point between bcopy and zcopy • Buffer-reuse and registration cost affect this ( registration ~= 32K bcopy ) • Affinity (mpiexec –affinity) • Definitely used for NUMA systems
MPI Tracing And Vampir • MSMPI Has built in ETW tracing • Low overhead • Three step process • Trace • Clocksync • Convert to OTF for viewing in Vampir • Explained in detail in the tracing guide • Traces can be externally launched through xperf
Reducing OS Jitter • Track Hard Fault with xperf • Disable non used services (up to 42+) • Delete Windows scheduled tasks • Change GP update interval (90mn by default)
Hunting Hard Faults • Track them with xperf • clusrunxperf -on HARD_FAULTS+PROC_THREAD • clusrunxperf -d c:\%%COMPUTERNAME%%.etl • Collect and view them
Xperf results • Some hard fault are not visible, you need to zoom Processes Hard Faults
Windows 2008 – Known issues • SMB2 protocol • Much more scalable in general • Supports true synchronous network writes • Non-buffered I/O is not automagically buffered • SMB1 and NFS differ in this • Run with local scratch / output files to confirm • Random Access I/O • Serious Regression in W2K8 for writes > size of RAM • Fixed in R2 • Non-invasive workarounds are hard.
What else have we seen? • Processor Issues • BIOS Issues • Processor never in C0 • Snoop filtering issues • Southbridge limiting DDR performance • Seems specific to Santa-Rosa opterons • Classic RAID setups without write caching enabled • Nasty interactions between interrupt moderation and RSS on certain NICs
Required Slide Speakers, TechEd 2009 is not producing a DVD. Please announce that attendees can access session recordings at TechEd Online. Resources • www.microsoft.com/teched Sessions On-Demand & Community • www.microsoft.com/learning • Microsoft Certification & Training Resources • http://microsoft.com/technet • Resources for IT Professionals • http://microsoft.com/msdn Resources for Developers
Required Slide Speakers, please list the Breakout Sessions, TLC Interactive Theaters and Labs that are related to your session. Related Content DEV401 Building High Performance Parallel Software DEV307 Parallel Computing for Managed Developers SVR311 Windows Performance Troubleshooting and Analysis SVR03-IS HPC and Virtualization: Considerations and Strategies
Required Slide Track PMs will supply the content for this slide, which will be inserted during the final scrub. Track Resources The windows performance toolkit is here http://www.microsoft.com/whdc/system/sysperf/perftools.mspx Windows Internals series is very good Basic windows server tuning is here http://www.microsoft.com/whdc/system/sysperf/Perf_tun_srv.mspx Windows HPC Server 2008 is here http://www.microsoft.com/hpc
Complete an evaluation on CommNet and enter to win an Xbox 360 Elite!
Required Slide © 2009 Microsoft Corporation. All rights reserved. Microsoft, Windows, Windows Vista and other product names are or may be registered trademarks and/or trademarks in the U.S. and/or other countries. The information herein is for informational purposes only and represents the current view of Microsoft Corporation as of the date of this presentation. Because Microsoft must respond to changing market conditions, it should not be interpreted to be a commitment on the part of Microsoft, and Microsoft cannot guarantee the accuracy of any information provided after the date of this presentation. MICROSOFT MAKES NO WARRANTIES, EXPRESS, IMPLIED OR STATUTORY, AS TO THE INFORMATION IN THIS PRESENTATION.