Understanding Line Graphs: Independent vs. Dependent Variables
10 likes | 160 Vues
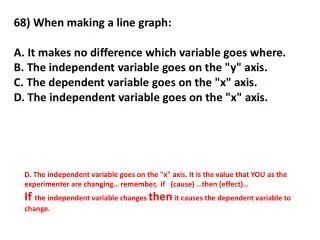
When creating a line graph, it's crucial to understand the placement of variables. The independent variable, which you manipulate as the experimenter, should always be located on the x-axis. Conversely, the dependent variable reflects changes due to the independent variable and should be plotted on the y-axis. Remember the cause-effect relationship: as the independent variable changes, it influences the dependent variable's value. Properly arranging your variables is essential for accurate data representation in your graph.

Understanding Line Graphs: Independent vs. Dependent Variables
E N D
Presentation Transcript
68) When making a line graph: A. It makes no difference which variable goes where. B. The independent variable goes on the "y" axis. C. The dependent variable goes on the "x" axis. D. The independent variable goes on the "x" axis. D. The independent variable goes on the "x" axis. It is the value that YOU as the experimenter are changing… remember, if (cause) …then (effect)… If the independent variable changes then it causes the dependent variable to change.