Download
1 / 18
180 likes | 376 Vues
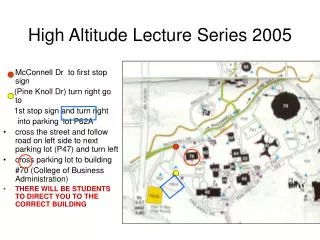
GG 313 Lecture 22 Series of Events Run Tests Correlation Nov 10, 2005. I have jury duty next Tuesday. No telling when or how long it will last, but I could be out Tuesday and Thursday. I will try to get a substitute, likely Cecily Wolf, to teach the class. HOMEWORK

E N D
GG 313 Lecture 22 Series of Events Run Tests Correlation Nov 10, 2005
I have jury duty next Tuesday. No telling when or how long it will last, but I could be out Tuesday and Thursday. I will try to get a substitute, likely Cecily Wolf, to teach the class.
HOMEWORK An isotope has a half life of 1.40x10⁷ years. Your sample has 10.0% of the original isotope left. How old is your sample? log(y1)=kt1=1 t1=1/k log(y2)=kt2=1/2 t2=1/(2k) t1/2=t2-t1=1/k-1/2k k=1/(2*t1/2) log(y)=t/(2t1/2) log(0.1)=t/(2*1.4x107) t= 2*1.4x107*log(0.1)=2.8*107 years
2) 1) Hawaii’s rate of population growth in 2003 was 1.3 %, and in July, 2003, there were 1.3x10⁶ residents of the islands. If this growth rate continues, when will the population be twice what it was in 2003? From the notes, divide the growth rate into70, and the result is the doubling time. 70/1.3=53 years, so the population of Hawaii, it this rate continues will be double what it was in 2003 in 2056. Most of you will be about 70 years old then…
3) Anova from the “help” menu The very small p-value of 6e-5 indicates that differences between the column means are highly significant. The probability of this outcome under the null hypothesis (i.e., the probability that samples actually drawn from the same population would have means differing by the amounts seen in X) is less than 6 in 100,000. The test therefore strongly supports the alternate hypothesis, that one or more of the samples are drawn from populations with different means.
Series of Events Examples: Earthquake occurrences volcanic eruptions magnetic reversals bentonite layers • Events are distinguished by when they occur • Events are short in duration • Events are rare and don’t overlap
Analysis of sequences involves finding characteristic intervals between events and relating them to underlying physical properties. Example: Earthquakes vs. time: Believe it or not, the earthquake sequence shown below has characteristics that allow prediction of the time of the next earthquake. Can you see why? The times of the earthquakes are the vertical black lines, and the length of each line is proportional to the size of the earthquake.
The red lines each have the same slope, implying that the strain builds up to some maximum level after each earthquake, at which time another earthquake occurs.
The sequence of earthquakes above is similar, but the underlying physical mechanism is different. In this case, the strain always decreases to some fixed minimum level after an earthquake. Can you predict anything in this case?
In the first case, the time between earthquakes is proportional to the strain relief during the last quake. In the 2nd case, the size of the next earthquake depends on the time since the last earthquake. Search for trends: Is the activity (density, volume, whatever) increasing or decreasing with time? To see if there is a significant trend, we first find the mean or centroid: (5.25) and the z-value is just: (5.26) where T1/2 the half way time, and T is the total time length.
If there is no significant trend, the series is deemed STATIONARY. Many geological phenomena should be stationary over long time periods, such as plate motion, strain rate on plate boundaries, etc. We can construct cumulative curves, such as cumulative strain along a fault, and use the Kolmogorov-Smirnov test to see if the sequence is statistically stationary. RUN TESTS: Sequences where only two states are involved are easy to test for randomness using a run test. There’s nothing in the earlier tests we used to check for randomness in the ORDER that the states occur in. For example while 100 coin tosses may have 50 heads and 50 tails, it would be highly un-random to have the order be 50 heads followed by 50 tails.
A “run” is defined as an uninterrupted sequence of the same state. To test for randomness, we do the following: • count n1 and n2, the number of occurrences of state 1 and 2, • count the total number of runs (U) • calculate the expected number of runs (n1,n2>20) (5.29) 4) calculate the variance: (5.30) (5.31) 5) calculate the z- statistic:
A related procedure looks at up and down runs. This method can have any number of states, and checks to see whether the next value is ≥ or ≤ the previous value. A run continues until the change from the last value changes sign. In the figure above, there are 5 runs, three up and 2 down. We can then use the U-test to see of the series is random.
EXAMPLE: Density measurements across a magnetite body. Do the densities vary randomly about the median, or is there a trend? The median is found to be 3.98 and when we subtract the median from each value, we get either a positive or negative result. There are seven groups of + and - ‘s, so U=7, and n1=19, the number of -’s, and n2=20, thus, Since z>3, there is greater than 99% confidence that the variations are not random.
CORRELATION Autocorrelation The main purpose of time series analysis is to learn something about the periodicities, trends, and repeating patterns in the data, and to infer something about the underlying physical processes. To find repetitions and patterns we need a measure of self-similarity. The most common measure is autocorrelation. The autocorrelation function is like the correlation function except that the two copies of the function are LAGGED with respect to each other. The correlation coefficient defined as (5.37,8)
If the two functions, x and y, are identical but offset in time, then the result is the autocorrelation function. At zero lag, the two identical functions are compared, and the result is the autocovariance. Normalizing by dividing by the autocovariance, the result is 1.0. We can get the autocorrelation function from the covariance function: (5.46) Characteristics of the autocorrelation function are that: • it can never be larger than ±1, • r(=0)=1 • r is symmetric around =0
White noise - totally random data, has an autocorrelogram equal to 1 at =0 and 0 elsewhere within the standard deviation of the signal. If the time series alternates, the correlogram will also. The autocorrelogram of a cosine wave is another cosine wave. Trends and outliers will cause problems - remove them before generating the autocorrelation. What is the autocorrelation of a boxcar? Cross-correlation: Corss-correlation is the same idea as autocorrelation, except that the two functions being correlated are different. Since they are different, the zero-lag position is not defined and the function will be asymmetric. It is also highly likely that the functions will have different lengths.
Maxima in the cross-correlation will occur when the two functions are most alike. If the correlation is significantly different from zero, then the two functions show correlation. Cross-correlation is the PRIME function used in reflection seismology in the search for oil. In “Vibroseis” work, a known signal is sent into the ground from a weighted truck. The signals recorded by seismometers are then cross-correlated with this signal to obtain a seismogram. Cross correlation of genomes allows conviction of criminals and detection of diseases. I used cross-correlation in my dissertation to detect moonquakes.