Download

1 / 21
210 likes | 224 Vues
Explore a two-step approach in studying biological systems: from gene selection based on experimental values to functional interpretation using GO terms and t-tests. Analyze cooperative gene activities and detect macroscopic observations from gene expression data. Utilize FatiScan for segmentation tests and nested inclusive analysis. Apply this methodology in case studies like cancer and survival data to understand gene expression dynamics.

E N D
From genes to functional blocks in the study of biological systems Fátima Al-Shahrour, Joaquín Dopazo Department of Bioinformatics, Centro de Investigación Príncipe Felipe, and Functional genomics node, INB, Valencia, Spain. http://www.gepas.org. http://www.babelomics.org http://bioinfo.cipf.es National Institute of Bioinformatics, Functional Genomics node
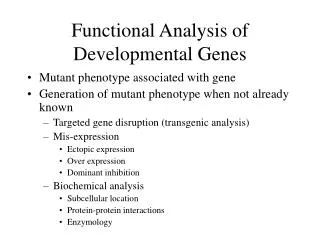
Metabolism Transport ... Reproduction Two-steps functional interpretation Genes are selected based on their experimental values and... 1 2 Enrichment in functional terms is tested (FatiGO, GoMiner, etc.) t-test A B 1 - A 2 1 test statistic B 2 test Metabolism Transport ... Reproduction +
test test interpretation test test experiments test test test : : test .... Two-steps approach reproduces pre-genomics paradigms interpretation pass test experiments no Context and cooperation between genes is ignored
Cooperative activity of genes can be detected and related to a macroscopic observation A B GO1 GO2 GO3 Ranking: A list of genes is ranked by their differential expression between two experimental conditions A and B(using fold change, a t-test, etc.) Distribution of GO: Rows GO1, GO2and GO3represent the position of the genes belonging to three different GO terms across the ranking. The first GO term is completely uncorrelated with the arrangement, while GOs2 and 3 are clearly associated to high expression in the experimental conditions B and A, respectively. Note that genes can be multi-functional - statistic +
Classes expressed as blocks in A and B Very few genes selected to arrive to a significant conclussion on GOs 1 and 2 A previous step of gene selection causes loss of information and makes the test insensitive A B GO1 GO2 - If a threshold based on the experimental values is applied, and the resulting selection of genes compared for over-abundance of a functional term, this migh not be found. Significantly over-expressed in B t-test with two tails. p<0.05 statistic Significantly over-expressed in A +
A previous step of gene selection causes loss of information and makes the test insensitive A B GO1 GO2 - The main problem is that the two-steps approach cannot distinguish between these two different cases. We put both sides of the partition into two bags and destroy the structure of the data. Significantly over-expressed in B t-test with two tails. p<0.05 statistic up down GO 3 9 no GO 0 25 Same contingency table for GO1 and GO2 !! Significantly over-expressed in A +
FatiScan, a segmentation test, provides an easy approach to directly test functional terms A B GO1 GO2 GO3 E.g., term 2, partition p1 - p1 up down p2 GO 4 6 no GO 2 30 p3 statistic GOs can be directly tested by a segmentation test. A series of partitions of the list are performed (p1, p2, p3…) and the GO terms for each functional class in the upper part are compared to the corresponding ones in the lower part by a Fisher test. Asymmetrical distributions of terms towards the extremes of the list will produce significant values of the test. Finally, p-values are adjusted by FDR Al-Shahrour et al., 2005 Bioinformatics +
Obtaining significant results A B term background - p1 p2 p3 statistic For each GO term (T), different partitions (P) are tested. TxP p-values of tests to be adjusted for multiple testing. Empirical results suggest that 20 to 50 partitions optimally find significant asymmetrical distributions of terms Al-Shahrour et al., 2005 Bioinformatics +
Nested inclusive analysis Levels from 9 up to 3 are tested. The deepest significant level is reported
U % Genes with the specific GO annotation for each partition L + + - - + + - - U L
Nevertheless, many pathways, and functional blocks are significantly activated/deactivated Case study: functional differences in a class comparison experiment A B No one single gene shows significant differential expression upon the application of a t-test A 8 with impaired tolerance (IGT) + 18 with type 2 diabetes mellitus (DM2) B 17 with normal tolerance to glucose (NTG) (Mootha et al., 2003)
Beyond discrete variables: Survival data Since FatiScan depends only on a list of ordered genes, and not on the original experimental values, it can be applied to different experimental designs Microarrays 34 samples from tumours of hypopharyngeal cancer (GEO GDS1070) - Survival GEPAS t-rex tool Gen risk Gen1 5.8 Gen2 5’6 Gen3 5.4 Gen4 5.2 Gen5 5.2 Gen6 5.0 …… …. …… …. …… …. Gen1000 -6.0 Gen1001 -6.3 Cox Proportional-Hazards model to study how the expression of each gene across patients is related to their survival + Survival
Functional analysis of a time series in P. falciparum ... • Genes at each time point are ranked from highest (red) to lowest (green) relative expression with respect to time 1. • For each list of ranked genes generated in any time point, the significant over-represented GO terms in the tail corresponding to the highest expression values are recorded. • The partitions used to decide that a given term is significantly over-represented in the upper tail of the list with respect to the lower part are used for the graphical representation.
Beyond arrays: evolutionary systems biology Mutations occur on single genes but natural selection acts on phenotypes by operating on whole sub-cellular systems (represented by GO). Comparison of the relative rates of synonymous (Ks) and non-synonymous (Ka) substitutions. The ratio of these values, the (w=Ka/Ks) is a widely accepted measure of the selective pressure We are interested in the human linage 20,469 known Ensembl human protein-coding genes from the Ensembl v.30.35h were used
GO terms positively selected in humans GO term p-value sensory perception of smell (GO:0007608)1.3 x 10⁻⁵ sensory perception of chemical stimulus (GO:0007606) 0.0014 G-protein coupled receptor protein signalling pathway (GO:0007186)0.0095 FatiScan is applied to the list of human genes ordered according w values If genes positively selected are firstly detected and then analysed for significant enrichment of GO (two-steps approach), no results are found Logw Fig 6
Comparison of methods for testing directly GO (or other terms) at a glance GSEA 2003 FatiScan 2005 PAGE 2005 Tian 2005 Terms from distinc repositories, reported by different methods in the diabetes dataset (Mootha et al., 2003)
The babelomics suite for functional annotation of experiments • Biological information from: • GO • Interpro motifs • KEGG pathways • Swissprot keywords • Tissues • Text-mining • Chromosomal location • For • Human, mouse, rat, chicken, fly, worm, yeast, A. thaliana and bacteria • Tests for lists of genes or blocks of functionally related genes http://www.babelomics.org http://babelomics.bioinfo.cipf.es http://www.babelomics.org
Two-colour arrays Blocks of genes Multi classes T-Rex DNMAD Survival Two classes Correlation GSEA Preprocessor Random forest FatiScan Prophet DLDA KNN SVM Expresso Babelomics Affymetrix arrays FatiGO+ ISACGH Marmite CAAT TMT FatiGO Raw data SOM Hierarchical Two sets of genes K-means SOTA Normalization Clustering GEPAS Differential expresion Arrays-CGH Class Prediction Functional Annotation Herrero et al., 2003, 2004; Vaquerizas et al., 2005 NAR; Montaner et al., 2006 NAR; Al-Shahrour et al., 2005, 2006 NAR; 2005 Bioinformatics RIDGE analysis
More than 150,000 experiments analysed during the last year. More than 500 experiments per day. Somenumbers 24h usage map as of June 8, 2006
Summary • Methods that directly address functional hipothesis are much more sensitive for the functional interpretation of any type of large-scale experiment. • Methods that do not require of the original data (such as the FatiScan) can be applied in a wider range of experimental designs in microarrays (class comparison, survival, etc.) and can be applied to any large-scale experiment or theoretical study in which a value can be assigned to any gen that allows generating a list of ranked genes. • Despite the differences in the tests, distinct functional interpretation methods seem to produce comparable results (although a more detailed benchmarking is necessary). http://www.babelomics.org http://www.gepas.org
The bioinformatics department at Centro de Investigación Príncipe Felipe (Valencia, Spain)... Joaquín Dopazo Eva Alloza Leonardo Arbiza Fátima Al-Shahrour Jordi Burguet Lucía Conde Hernán Dopazo Toni Gabaldon Jaime Huerta Marc Martí Ignacio Medina Pablo Minguez David Montaner Joaquín Tárraga Juan Manuel Vaquerizas ...and the INB, Instituto Nacional de Bioinformática (Functional Genomics Node)