Download
1 / 10
100 likes | 308 Vues
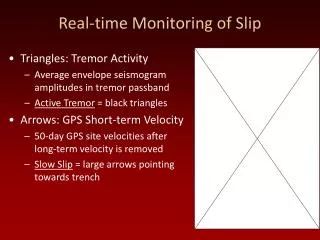
Real-time Monitoring of Slip. Triangles: Tremor Activity Average envelope seismogram amplitudes in tremor passband Active Tremor = black triangles Arrows: GPS Short-term Velocity 50-day GPS site velocities after long-term velocity is removed Slow Slip = large arrows pointing towards trench.

E N D
Real-time Monitoring of Slip • Triangles: Tremor Activity • Average envelope seismogram amplitudes in tremor passband • Active Tremor = black triangles • Arrows: GPS Short-term Velocity • 50-day GPS site velocities after long-term velocity is removed • Slow Slip = large arrows pointing towards trench
NVT Location Approach • Filtered envelope waveforms • STA/LTA to find NVT bursts • Pick relative times of good S/N arrivals • By hand and/or automated • 1D inversion for locations • Analyze for patterns in space and time
NVT Migration in Southern Cascadia 2005-2006: Hand-picked vs. Automated
NVT Migration Along All of Cascadia 2007-2008 (Automated) • Still preliminary, but find long migrating episodes that overlap in time despite being separated by >100 km • Three 2007-2008 events are more interrelated along-strike than all events in previous few years
NVT Locations So Far • Still plenty of work for us to do in the northern half • Beginning to see a persistent gap at OR-CA border • NVT band primarily between 30-40 km slab contours • Matches some aspects of slab curvature
Integrating ETS with Earth Structure and Geology Arc volcanism Surface Wave Crust Structure Body WaveMantle Structure ETS Periodicity Schmidt et al., 2008 Brudzinski & Allen, 2007