Download
1 / 36
360 likes | 386 Vues
Understand the impact of climate change on global, regional, and sectoral levels. Explore mitigation, adaptation practices, technologies, and costs outlined by the WTO-UNEP report. Learn about greenhouse gas emissions, global warming, temperature projections, and climate modeling scenarios. Access climate system insights and projections for a sustainable future.

E N D
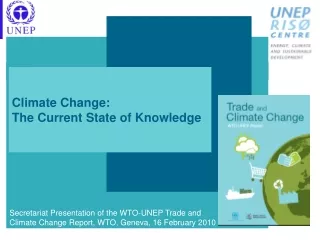
Climate Change: The Current State of Knowledge Secretariat Presentation of the WTO-UNEP Trade and Climate Change Report, WTO, Geneva, 16 February 2010
Outline • Introduction: Greenhouse gases, climate change and climate change projections • Climate change impacts: Global, regional and sectoral dimensions • Approaches for dealing with climate change: Mitigation and adaptation: • Potential • Practices • Technologies • Costs • Concluding remarks
Introduction “Warming of the climate system is unequivocal.” "Most of the observed increase in global average temperatures since the mid-20th century is very likely due to the observed increase in anthropogenic greenhouse gas concentrations.“ IPCC Fourth Assessment Report (2007)
Climate versus weather • Climate: A statistical description of the mean and variability of temperature, precipitation, wind, etc. over a period of time ranging from months to thousands or millions of years • Weather: The present condition of the above elements, typically over periods up to two weeks • Climate change: A change in the state of the mean and/or variability of these elements that can be identified statistically and that persists over a longer period, typically decades or longer.
Greenhouse gas (GHG) emissions and global warming • Sharp increase in the emissions of GHGs and their concentration in the earth’s atmosphere since the onset of industrialisation • GHGs cause heat from the sun to be retained in the atmosphere contributing to global warming and CC • Atmospheric concentration of CO2 increased by 36% over the past 250 years • More than 60% of this increase has taken place in the last 50 years
‘Translating’ emissions into warming • Predictions of future climate change and its likely impacts are based on projections of greenhouse gas emissions and climate model estimation of associated impacts • IPCC scenarios provided in the Special Report on Emission Scenarios (SRES) in 2000, present most frequently used baselines for climate change projections: • Four different ‘families’ of storylines provide a wide range of possible future emissions up to 2100 that can be used as baselines for climate modelling and economic analyses of climate change. • Each storyline and corresponding scenario has different assumptions about technologies and energy sources/use, rate of economic growth, governance structures, etc.
‘Translating’ emissions into warming Scenario Projections: • Increase in GHG emissions 25-90% for 2000-2030 • Warming: 0.2° C per decade up to 2020 • After 2020, temperature projections increasingly depend on the specific scenario Climate model estimates: • Global average temperature rise from 1.4 to 6.4° C between 1990 and 2100
Many greenhouse gases remain in the atmosphere for very long periods Time lag between the moment of emission and the new equilibrium of the climate system World Bank (2008) estimate: Global warming of around 2°C is probably unavoidable by now The corresponding best estimate from the IPCC (2007) is 1.8°C CC is a concentration problem as well as an emission problem → Global warming will continue to affect the natural systems of the earth for several hundred years, even if greenhouse gas emissions were substantially reduced or ceased altogether today
Increased certainty on the links between warming and impacts • Improved analyses of temperature records • Use of new computer models to estimate variability and climate system responses to both natural and man-made causes • Increased understanding of climate processes enabling incorporation of more detailed information: • Sea-ice dynamics • Ocean heat transport • Water vapour → Greater certainty that the links observed between warming and its impacts are reliable
Observed and projected climate change impacts Global, regional, and sectoral dimensions
Observed temperature changes • Global average temperatures and the rate of change have increased over the past 150 years : • The global average surface temperature increased by about 0.74°C between 1906 and 2005, • The warming trend per decade has been almost twice as high for the last 50 years compared to the trend for the past 100 years • From 1976 to 2007, the rate of temperature change was three times higher than the rate for the past 100 years • Measurements from weather balloons and satellites indicate that warming rates in the atmospheric temperature are similar to those observed in surface temperature
Model projections of surface warming and regional differences
Observed changes: Significant increases: Northern Europe Northern and central Asia Eastern parts of North and South America Decreases: Parts of southern Asia The Mediterranean The Sahel Southern Africa Projected changes: Substantial increases in annual mean precipitation: Most high latitude regions Eastern Africa Central Asia Substantial decreases: The Mediterranean region The Caribbean region Sub-tropical regions Changes in precipitation
Climate variability and extreme events • Frequency and intensity of extreme weather events are observed and are projected to increase even with small temperature increases • Heavy precipitation events projected to have potential negative impacts on trade through disruption to infrastructure and as a result of may not be limited to direct damage to agricultural outputs • Climate variability and extreme events exacerbate the general impacts of climate change in specific locations at specific points in time
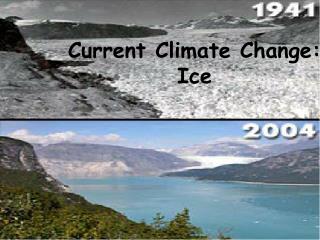
Sea level rise and changes in snow, ice and frozen ground • Sea level rise projections vary significantly depending on climate models and assumptions • Changes in sea ice may lead to availability of new shipping routes with significant implications for transport and exploitation of resources, including fossil fuels • Changes in permafrost and increasing ground instability has implications for transport, industry and infrastructure
Approaches for dealing with climate change: Mitigation and Adaptation Avoiding the unmanageable and Managing the unavoidable UNCSD 2007
Mitigation: Avoiding the unmanageable • Mitigation is defined by the IPCC as technological change and substitution that reduce resource inputs and emissions per unit of output • Requires implementation of policies and measures to reduce greenhouse gas emissions and/or enhance carbon sinks
Trends in GHG emissions • Global GHG emissions have increased by 100% from 1970s to 2005 • GHG emissions projected to increase another 80% by 2050 if there are no significant changes to current policies • CO2 emissions are the fastest growing and annual growth rates have increased from 1.1% in the 1990s to more than 3.0% in 2000-2004 → Current trends in GHG emissions indicate that we are heading towards the higher end of the IPCC scenarios
Trends in the structure of GHG emissions • Industrialised countries bear main responsibility for past emissions and current atmospheric concentrations of GHGs • Emissions per capita in industrialized countries are around four times higher than those in developing countries’ • CO2 intensity of developing countries > industrialized country – Indicating a significant potential for efficiency gains • Annual energy-related carbon dioxide emissions from non-OECD countries now surpass emissions from OECD countries. • Total annual GHG emissions of industrialized countries and developing countries are now roughly the same • 8 out of the top 20 GHG emitting countries are DCs • Developing countries account for roughly 2/3 of the flow of new emissions • Average annual increase in emissions for 2005-2030 projected at 2.5% for non-OECD countries and 0.5% for OECD countries → Any effective response to climate change must include both industrialised and developing countries
Global flow of GHG emissions by sector and end-use Activity Source: Baumert et al. (2005)
Mitigation options and potential • Significant emission reductions requires exploiting mitigation potentials across all sectors - involving a broad range of technologies • Key options for mitigation include: • Using energy more efficiently to reduce the emissions from fossil fuel use • Switching to zero- or low-carbon energy technologies • Reducing deforestation • Introducing improved farming practices and waste treatment • Deployment of existing technologies and technologies currently under development would enable realisation even of ambitious emission targets
Stabilisation targets and associated cost estimates Two stabilization targets widely discussed and analysed: • Limiting increases in temperature to 2°C (corresponding to a GHG concentration range of 445-490 parts per million) to avoid dangerous anthropogenic interference with the climate system • Advocated e.g. by the EU • Limiting increases in temperature to approximately 3°C, corresponding to a stabilisation of CO2 levels in the atmosphere at around twice the pre-industrial level • More extensively studied in science, and suggested by the IPCC as an upper threshold for avoiding dangerous human interference with the climate system
Mitigation and cost implications of the two stabilisation targets • 2°C target: • Emissions reduction: 50-85% relative to 2000 level by 2050 • Macro-economic costs: annual reduction in global GDP of more than 3% (IPCC) • 3°C target: • Emissions reduction: 30% lover to 5% higher than emission levels in 2000 by 2050 • Macro-economic costs: annual reduction in global GDP of 0.2-2.5% (IPCC); 1% (Stern Review)
Carbon prices • Carbon pricing: Equalising the marginal cost of CO2 emission reductions for all sources of emissions by introducing a price per tonne of CO2 -equivalent GHG emissions reduced • Enables comparison of emission reduction potentials for sectors and technologies at various carbon prices • Creates incentives to undertake research and development and to innovations in energy-saving and climate-friendly technologies
Mitigation potentials by sector and as a function of carbon prices, I • Building sector: Largest potential for GHG emission reductions, much at low cost. Technologies include energy efficiency; improved cooking stoves; solar heating; and, efficient lighting and appliances. • Energy supply sector: High potential and increasing with carbon prices up to 50 USD. Technologies include: Improved supply and distribution efficiency; fuel-switching from coal to gas; nuclear power; renewable heat and power sources; combined heat and power; early applications of Carbon Capture and Storage • Industrial sector: High potential that increases with carbon prices. Technologies include efficient end-use equipment; heat and power recovery; material recycling and substitution; carbon Capture and Storage
Mitigation potentials by sector and as a function of carbon prices, II • Agriculture and forestry: High potential at all levels of carbon prices. Available technologies include Improved crop, livestock, forest and land management and cultivation techniques; restoration of cultivated peaty soils and degraded lands; improved nitrogen fertilizer application techniques; dedicated energy crops to replace fossil fuel use; improved energy efficiency; afforestation; reduced deforestation • Transport and waste sector: GHG emission reduction potential not very responsive to carbon price increases. Technologies include fuel-efficient, hybrid and cleaner diesel vehicles; biofuels; shifts from road transport to rail and public transport systems; non-motorized transport; land use and transport planning.
Global GHG abatement cost curve Source: McKinsey & Companys Global GHG Abatement Cost Curve v2.0
Adaptation: Managing the unavoidable • Adaptation is defined by the IPCC as an “adjustment in natural or human systems in response to actual or expected climatic stimuli or their effects, which moderates harm or exploits beneficial opportunities.” • Effective options for adaptation depend on specific geographical and climate risk factors as well as on socio-economic, institutional, political and financial circumstances
Typology of adaptation technologies • Hard technologies: tools, equipment, physical facilities, etc. • Soft technologies: management, behavioral changes, knowledge to use tools and machinery. • “Org-ware”: institutional framework or organisation required to implement the technology. • Sectors commonly used: freshwater resources, forests and ecosystems, agriculture, coastal systems, industry, and health
Differences between adaptation and mitigation technologies • Climate adaptation is often the continuation of an ongoing process where the same techniques have been used for generations (e.g. houses on stilts) • Few technologies are specifically designed for adaptation, rather they respond to broader sustainable development needs (e.g. improved water quality) • Adaptation technologies are often less capital intensive, suitable to small-scale interventions and local variations and context • The effects/outcomes of adaptation cannot be measured by a single indicator (such as reduction in CO2-equivalent emissions), and are interlinked with broader development issues • Transfers of adaptation technologies does not necessarily follow a north-south approach of equipment and practices. Technologies may already be in place but face barriers to implementation and use
Adaptation costs • Consensus that the costs of adaptation will generally be smaller than the benefits, and that climate change impacts and the associated need for adaptation will increase the cost of, and potential for, economic development in developing countries • Few adaptation cost and benefit estimates have been carried out to date, but more studies are becoming available, particularly for specific adaptation options at regional or project level • Global adaptation cost figures are limited and the assumptions about climate change impacts and adaptation activities and technologies underlying their derivation still coarse
Estimates of global annual adaptation costs in developing countries New estimates from the World Bank (2010) indicates that annual costs are in the order of $100 billion annually
Concluding remarks • Scientific evidence on climate change and its impacts is conclusive • Climate change is a concentration problem as well as an emission problem and both mitigation and adaptation is needed in an effective response • Any effective mitigation response strategy must include both industrialised and developing countries • Copenhagen…Good COP or Bad COP? • Never have so many heads of state given such priority to the issue • COP 15 moved climate change to the relevant level of political engagement: Issues go beyond environmental aspects and affect key economic development, trade and equity questions