Download
1 / 27
270 likes | 374 Vues
A comprehensive study analyzing cool season tornadoes in the Southeast U.S., focusing on physical mechanisms and mesoscale features influencing tornado occurrence. The research includes composite tornado events, severe weather reports, satellite images, soundings, surface trajectories, and conclusions linking tornado development to Gulf SST anomalies and frontogenesis.

E N D
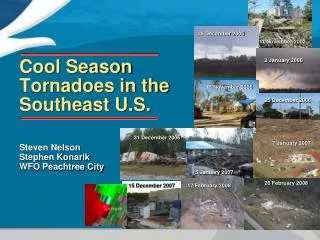
A Study of Cool Season Tornadoes in the Southeast United States • Alicia C. Wasula and Lance F. Bosart • University at Albany/SUNY • and • Russell Schneider, Steven J. Weiss, and Robert H. Johns • Storm Prediction Center
Motivation • Understand physical mechanisms behind cool season (November – March) tornado occurrence in the Southeast U.S. • Understand role of mesoscale features in modifying large-scale environment to enhance or inhibit tornado development
Number >=F2 Tornadoes Number Cool Season >=F2 Tornadoes FL 228 115 CO 396 210 AP 976 460 MR 1071 560 OZ 250 142 Cool Season = November-March
Percent Tornadoes (>=F2) by Month Percent Tornadoes (>=F2) by Hour (UTC)
COMPOSITE TORNADO EVENT 0000-0600 UTC (n=393, Tornado point = 32 N, 90 W) 500 hPa heights (solid, dam), vorticity (dashed, x 10-5 s-1), vort. advection (shaded, x 10-10 s-2) 200 hPa heights (solid, dam), isotachs (shaded, m s-1)
COMPOSITE TORNADO EVENT 0000-0600 UTC (n=393, Tornado point = 32 N, 90 W) 850 hPa heights (solid, m), temperature (dashed, °C), temp. advection (shaded, x 10-5°C s-1) 1000 hPa heights (solid, m), 1000-500 hPa thck (dashed, dam), 700 hPa relative humidity (%)
COMPOSITE TORNADO EVENT 0000-0600 UTC (n=393, Tornado point = 32 N, 90 W) 700 hPa heights (solid, m), vertical motion (dashed and shaded, x 10-3 hPa s-1), 850-500 hPa lapse rate (dashed°C), 850 hPa e (shaded, K), 850 hPa winds
SEVERE WEATHER REPORTS: 22-23 February 1998 7 Tornadoes 3 F3 42 Fatalities 260 Injuries Blue = Wind > 25.7 m s-1 Green = Hail > 1.91 cm Red = Tornado
22 February 1998 0000 UTC AVN Analysis SFC 500 hPa 200 hPa 850 hPa
22 February 1998 1200 UTC AVN Analysis SFC 500 hPa 200 hPa 850 hPa
23 February 1998 0000 UTC AVN Analysis SFC 500 hPa 200 hPa 850 hPa
Tampa Bay (TBW) Sounding and Hodograph 23 February 1998 0000 UTC CAPE = 2891 J/kg LI = -9 C LCL = 962 hPa V (m s-1) U (m s-1)
22/1815 UTC IR Satellite
22/2115 UTC IR Satellite 23/0015 UTC IR Satellite 22/2345 UTC IR Satellite
23/0100 UTC BREF Mosaic Surface Temp. (°C) and contours 23/0015 UTC 22/2255 UTC
23/0200 UTC BREF Mosaic Surface Temp. (°C) and contours 23/0315 UTC 23/0145 UTC
23/0300 UTC BREF Mosaic Surface Temp. (°C) and contours 23/0530 UTC
23/0400 UTC BREF Mosaic Surface Temp. (°C) and contours
23/0500 UTC BREF Mosaic Surface Temp. (°C) and contours
23/0600 UTC BREF Mosaic Surface Temp. (°C) and contours
Surface Frontogenesis (°C 100 km-1 3 h-1) 23/ 0000 UTC 23/ 0200 UTC 23/ 0400 UTC 23/ 0600 UTC
Surface Trajectories Ending 23/0400 UTC End point north of boundary End point south of boundary
Surface Vorticity (x 10-5 s-1) 23/ 0000 UTC 23/ 0200 UTC 23/ 0600 UTC 23/ 0400 UTC
Conclusions • Case study fits with composite results on synoptic scale • Convection reorganized into line of tornadic supercells after landfall • Intensity of squall line related to Gulf SST anomalies • Strong frontogenesis maintained east-west baroclinic zone and enhance upward motion in warm air across central Florida • Baroclinic zone maintained strength as surface air traversed over anomalously warm (cold) SST anomalies to south (north) • Increase in ambient surface absolute vorticity on FL peninsula is associated with evolution of line into supercells