Download
1 / 56
560 likes | 696 Vues
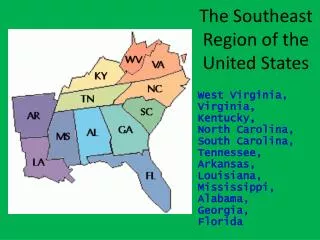
Dynamical Downscaling of Climate for the Southeast United States. Lydia Stefanova Center for Ocean-Atmosphere Prediction Studies (COAPS) Florida State University. With contributions from Tim LaRow (FSU/COAPS) and Michelle M. Irizarry-Ortiz and Jayantha Obeysekera (SFWMD). Outline.

E N D
Dynamical Downscaling of Climate for the Southeast United States Lydia Stefanova Center for Ocean-Atmosphere Prediction Studies (COAPS) Florida State University With contributions from Tim LaRow (FSU/COAPS) and Michelle M. Irizarry-Ortiz and Jayantha Obeysekera (SFWMD)
Outline • La Florida climate downscaling experiments • Available data • Regional model configuration • Results from downscaling of reanalysis: CLARReS data set • Preliminary results from a climate change scenario
Downscaling Experiments • 20 century: 1979-2000 for reanalyses (R2 and ERA-40), 1969-2000 for models (CCSM, GFDL, HadCM3) • 21 century: A2 scenario 2039-2070 • Blue (reanalyses) and Green (climate scenarios): completed • Yellow: pending
Vegetation Scenarios Historical Present
What is a Reanalysis? A retroactive "best guess" for the state of the atmosphere based on all available observations and knowledge. The observations (relatively sparse, and possibly containing errors and thus not necessarily mutually consistent) are assimilated into a dynamical forecast model which is run for a very short time (essentially creating a now-cast) to produce a best estimate for the state of the atmosphere (including variables that are not available from observations, but are derived through the model equations (based on fluid dynamics and physics)) as a spatially and physically consistent gridded data set. In summary, a reanalysis is our best guess about the atmospheric fields of the recent weather and climate, based on a combination of a) observations and b) modeling knowledge of the physics and dynamics of the atmosphere. To obtain dynamically downscaling regional reanalysis, the global reanalysis is used to force a regional model
Model, Input, and Output • Regional Model: National Centers for Environmental Prediction (NCEP)/Experimental Climate Prediction Center (ECPC) Regional Spectral Model (RSM) • Input: Global reanalysis (NCEP’s R2 or ECMWF’s ERA-40), atmospheric winds, temperature, humidity, and surface pressure at 6-hourly intervals as lateral boundary conditions. • Output: Regionally downscaled reanalysis: COAPS Land-Atmosphere Regional Reanalysis for the Southeast (CLARReS-R2 or CLARReS-ERA40), hourly 2-D variables, 3-hourly 3-D variables
Available Data • ftp://ftp.coaps.fsu.edu/pub/Southeast/CLARReS10/ • Subdirectories: Documentation; ERA-40; R2 • Data uploaded in netCDF format • Request additional variables by emailing lstefanova@fsu.edu
Chattanooga Augusta Charleston Macon Montgomery Savannah Tallahassee Daytona Melbourne Tampa West Palm Beach Miami Domain and Model Configuration
Precipitation • Mean: wet bias outside of Florida; wet bias in CLARReS-ERA40 over Everglades; Dry bias over southeast Florida • Seasonal cycle: summer precipitation overestimated outside Florida • Interannual variability: generally proper sign • JJA frequency of rainy days: frequency of precipitation days is generally underestimated in Florida, and overestimated for Georgia, Alabama and South Carolina. The frequency of light events is generally underestimated, while that of heavy events is generally overestimated. Precipitation from tropical cyclones is realistic, provided the storms are present in the global model. • Diurnal cycle: Good agreement with observations
Annual Precipitation Rate Global Reanalysis (R2) Downscaled Reanalysis (CLARReS-R2) Observations (PRISM) mm/day [PRISM: Oregon State Climate Group data set, gauge-based, uses intelligent interpolation, 4km resolution] • Note grid size of global vs downscaled reanalysis: amount of detail • Comparable magnitudes. Note different spatial structure and bias.
Summer Precipitation Rate R2 CLARReS-R2 PRISM mm/day Very wet bias in the global reanalysis; reduced but not eliminated in downscaled version; Florida bias less than remainder of domain; Note that rainfall is not directly downscaled; Instead, the regional model produces its own rain from the atmospheric circulation generated from the winds/temperature/humidity forcing
Interannual VariabilityHow well is the DIFFERENCE between two years captured?
Difference of dry and wet winter month, (Jan 1988-Jan1987) (mm/day) R2 CLARReS-R2 OBS (UDel) ERA-40 CLARReS-ЕRА40 OBS (PRISM)
Difference of dry and wet summer month (Jun 1988-Jun1987) (mm/day) R2 CLARReS-R2 OBS (UDel) ERA-40 CLARReS-ЕRА40 OBS (PRISM)
Normalized Annual Cycle (Stations) COOP Station
Percent JJA days with Prate > 20mm/day CLARReS-R2 CLARReS-ERA40 Observations (CPC Unified)
Probability of exceeding a given precipitation threshold on any summer day
Diurnal Cycle of JJA PrecipitationHow is precipitation distributed throughout a typical summer day?
Time of diurnal maximum, GMT CLARReS-R2 CLARReS-ЕRА40 (EDT=GMT-4) OBS • Earlier maxima along the coasts (~18-20 GMT = ~2-4PM EDT); later inland (~22-24 GMT=6-8pm EDT) • Sea breeze convergence in peninsular Florida • Land breeze signature over the water
Tropical Cyclone Associated Precipitation (inches) Global Reanalysis CLARReS Observation Global Reanalysis CLARReS Observation
Tropical Cyclone Associated Precipitation (inches) Global Reanalysis CLARReS Observation CLARReS Observation Global Reanalysis
Hurricane Andrew [1992] Associated Precipitation (inches) Global Model CLARReS Observation Observations from HPC
Opal [1995] Wind Field (kts) CLARReS-ERA40 (21UTC04Oct1995) Observed H*Wind 10m Wind Speed 850hPa Wind Speed
Observed Snow Cover Satellite Image 12-15 March 1993 “Storm of the Century” … was an extratropical storm of unusual intensity affecting the Eastern US. Areas as far south as central Alabama and Georgia received 6 to 8 inches of snow. The Florida Penninsula recorded hurricane-force wind gusts and record-low barometric pressure. CLARReS-R2 (12UTC 13 March 1993)
Seasonal Cycle for Daily Average, Minimum and Maximum 2-m Temperatures(Assessment limited to Florida) Daily average temperature (Tave) is captured very well in both models. Daily maximum temperature (Tmax): • Both models overestimate Tmax across the state especially from Feb-Oct. • In both models Lake Okeechobee and areas very close to the coast show lower Tmax than interior areas (not evident in gridded observations). The models are probably correct. Daily minimum temperature (Tmin): • In general, Tmin is overestimated across the state, especially in northern Florida and in the Panhandle area. • In both models LOK and areas very close to the coast show higher Tmin than interior areas (higher Tmin over LOK not seen inPRISM or USGS). Models are probably correct.
Interannual Signal in Daily Tmin and Tmax • Interannual variability in the statistical distribution of daily minimum and maximum temperatures • Large-scale control from El Nino and La Nina: On average, El Nino winters are colder and wetter than La Nina years. • Standard deviation and anomalies • Skewness and kurtosis • Comparison with COOP station data
Daily Tmin El Nino (avg. cold and wet) La Nina (avg. warm and dry) CLARReS Station Observations
Daily Tmax La Nina (avg. warm and dry) El Nino (avg. cold and wet) CLARReS Station Observations
Downscaling of Regional Reanalises: Summary Precipitation • Downscaled reanalysis precipitation has wet bias outside of Florida; wet bias in CLARReS-ERA40 over Everglades; Dry bias over southeast Florida. • In Florida, the frequency of heavy rainfall is generally overestimated. • The shapes of annual and diurnal cycles are simulated well. • The interannual variability is simulated well. • Tropical storm precipitation is simulated well provided the storm is well inside the regional domain. Temperature • Tmax and Tmin generally overestimated; Average T generally OK. • Interannual variability and higher statistical moments simulated well. Hourly downscaled data available fromftp://ftp.coaps.fsu.edu/pub/Southeast/CLARReS10/
Preliminary results from downscaling of climate projections • Regional model forced with boundary conditions from the National Center from Environmental Prediction (NCEP) Community Climate System Model (CCSM) simulations. • Seasonal means for 1969-1999 subtracted from the seasonal means for 2039-2069. • Maximum and minimum daily temperatures (Tmin and Tmax), average daily temperature (Tave), precipitation rate (Prate, mm/day)