Climate Downscaling Techniques
Climate Downscaling Techniques. Marina Timofeyeva UCAR/NWS/NOAA. TALK OUTLINE. What is Downscaling NWS NCEP CPC climate outlooks and regional climate Downscaling methods Application of CPC methods in Developing Local Climate Products

Climate Downscaling Techniques
E N D
Presentation Transcript
Climate Downscaling Techniques Marina Timofeyeva UCAR/NWS/NOAA
TALK OUTLINE • What is Downscaling • NWS NCEP CPC climate outlooks and regional climate • Downscaling methods • Application of CPC methods in Developing Local Climate Products • Messages to take home
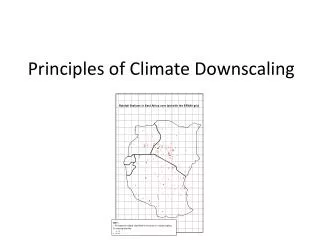
DOWNSCALING DOWNSCALING is the transformation from a LARGE SCALE feature to a SMALL SCALE one (not necessarily of the same kind). DOWNSCALING implies increasesresolution of output.
NWS NCEP CPC climate outlooks This is a map of 344 climate divisions currently in use over the U.S. Note the changing size as one goes from east to west, as well as from one state to another. CPC uses 102 mega or forecast divisions in their forecasts. The divisions in the West closely correspond to NCDC climate divisions.
NWS NCEP CPC climate outlooks Precipitation Climatology 1971 - 2000 National precipitation map based on high-resolution PRISM data (left) and on Climate Divisions (right). Note the large gradients and fine-scale variability in the Western U.S. that is not reproduced in the right map. Slide courtesy of Klaus Wolter, CDC
NWS NCEP CPC climate outlooks and Regional Climate Official CDs for Colorado (left) and Experimental CDs (right) based on multivariate statistical analysis of climate data that also include SNOTEL data. Such new CDs are being derived for the entire U.S.A. Slide courtesy of Klaus Wolter, CDC
NWS NCEP CPC climate outlooks and Regional Climate # of stations that did not reject the test H0 If climate at station is the same as at climate division, then mean and variance at station and climate divisions should be the same. THEY ARE NOT!
NWS NCEP CPC climate outlooks and Regional Climate NUMBER OF STATIONS (OUT OF 9) THAT HAVE SQUARED CORRELATION WITH CD >=0.8
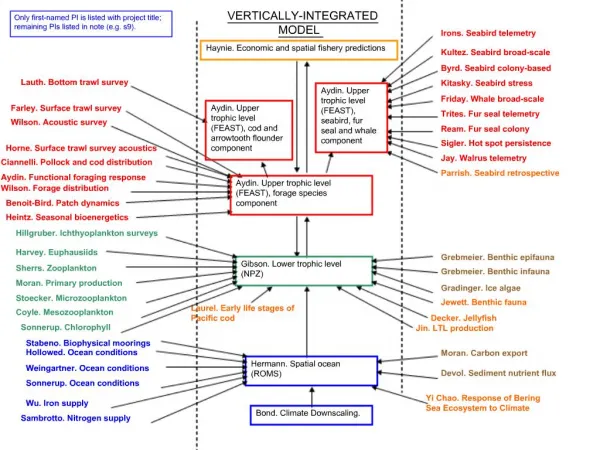
DYNAMICAL DOWNSCALING • ETA and AVN are examples on meteorological scale • Climate applications: • Regional Spectral Model (RSM) and Seasonal Forecast Model (SFM) • Nested in T62 and T40 NCEP coupled AOGCM using 50, 30 and 20 km resolution grids • tested for 1997 winter El Nino • results: • RSM shows improvement in temperature forecast in comparison with AOGCM • “50-km RSM is unable to forecast anomalies over high mountains” • 20-km RSM provides “realistic distribution of precipitation”, but overestimate its maxima
STATISTICAL DOWNSCALING WEATHER GENERATORS Global Circulation Pattern observed Climate observations Calibration Statistics Class Frequency analysis Statistics Prediction Global Circulation Pattern predicted Climate predictions
STATISTICAL DOWNSCALING CORRELATION MODELS Climate Observations GCM fields Calibration Statistics Statistics Statistical relationship Prediction Modeled climate Statistics
APPLICATION OF CPC METHODS IN DEVELOPING LOCAL CLIMATE PRODUCTS EXAMPLE: PARTNERSHIP PROJECT • Western Region HQ (Andrea Bair) • NWS OCWWS CSD (Marina Timofeyeva) • NWS NCEP CPC (David Unger)
Utilized CPC Methods of Downscaling Translation of probability of exeedance (POE) outlooks from climate divisions to local station temperature forecasts Use of composites in the forecast of local climate using climate variability modes
Utilized CPC Methods of Downscaling Temperature Outlook Precipitation Outlook Degree Day Outlook Temperature Outlook Precipitation Outlook Degree Day Outlook
Forecasted Temperature (°F) Utilized CPC Methods of Downscaling - POE Translation of forecast division POE to station forecast was developed in CPC by Barnston, Unger, and He. The POE outlooks became available in December 1994, and the translations to station temperature in 2000. Observed T POF (%)
Utilized CPC Methods of Downscaling - POE http://www.cpc.ncep.noaa.gov/pacdir/NFORdir/citydir/cpcctytd.dat
Utilized CPC Methods of Downscaling - POE Step 1: Defining stations where the station outlooks are used
Utilized CPC Methods of Downscaling - POE Step 2: Developing regression equations for those stations In most cases there is a strong relationship between temperature at station (y axis) and climate division (x axis).
Utilized CPC Methods of Downscaling - POE Step 2: Developing regression equations for those stations Regression coefficients are adjusted for the trend DifferenceTstation – Tcd (ºF) years
Utilized CPC Methods of Downscaling - POE Step 3: Test of regression equations stability - Cross validation Cross validation allows expansion of the test sample and protects against over fitting
Utilized CPC Methods of Downscaling - POE Step 3: Test of regression equations stability - Cross validation
Tobs Methods for Climate Forecast Verification Ranked Probability Score and Continuous Ranked Probability Score RPS is not sensitive for forecast spread. Tobs The Rank Probability Score (RPS), graphically represents the performance of the probability forecast (Wilks, 1995). Continuous Rank Probability Score (CRPS) takes into account spread of the forecasted distribution. CRPS Skill Score (CRPSS) is the final measure of the forecast performance.
Methods for Climate Forecast Verification Reliability Diagrams Reliability Diagrams exhibit the correspondence between the observed and forecasted percentiles. Reliability Diagrams allow verification of each POE for each station. The analysis is done for a forecast and compared with climatology. Under-forecasting Over-forecasting
Methods for Climate Forecast Verification Bias Analysis The bias is computed for CPC forecasts and for climatology using the equation shown on the right for climate divisions and stations for each forecast month and each lead season. The bias shows range and sign of deviations between forecasts and observations. Mean Square Error (MSE) is other common accuracy measure of climate forecast leading to skill score (SS) estimates. Expected PDF of difference between forecasts and observation is normal distribution with mean that is not significantly different from 0.
Utilized CPC Methods of Downscaling - POE When this method fails…
Utilized CPC Methods of Downscaling - POE When this method fails… ρ Station Forecast Spread R – Measure of Confidence in Downscaling
Mean = 60.7 St.Dev.= 13.6 Median = 59.5 Mode = 52.0 Skewness = 0.225 Kurt = -0.526 Utilized CPC Methods of Downscaling - POE When this method fails… Temperature is a normally distributed variable, therefore the downscaling method based on regression can provide good estimates Precipitation (right chart) is too skewed for normal distribution. The regression would require a transformation of this variable. Compositing can be used for Precipitation forecasts because it does not employ regression analysis. Mean = 0.30 St. Dev.= 0.38 Median = 0.19 Mode = 0.01 Skewness = 3.11 Kurtosis = 14.67 NOT a good fit
Utilized CPC Methods of Downscaling – COMPOSITES • Levels of sophistication in use of composites: • Composite means • Raw Composite distribution • Smooth resampled Composite Distribution - boot strapping techniques • All of the above with trend and some other mode of climate variability taken into account using new approach developed by Higgins, Unger and Kim
North Dakota, DJF Temp (°C) 1987 1992 1983 1973 1998 1958 1995 1988 1966 Nino 3.4 SST (°C) Utilized CPC Methods of Downscaling – COMPOSITES
Utilized CPC Methods of Downscaling – COMPOSITES – level 1
Utilized CPC Methods of Downscaling – COMPOSITES – level 2
Utilized CPC Methods of Downscaling – COMPOSITES – level 2 FORECAST: Given El Nino, Denver Tmean has a shift in Tmean toward above normal for Jan, below normal for Mar, and near normal for JFM
Utilized CPC Methods of Downscaling – COMPOSITES – level 2 JFM composites For each Nino 3.4. event we compute probability of the climate variable to be in Below/Near/Above normal category.
Utilized CPC Methods of Downscaling – COMPOSITES – level 2 CPC CURRENT ENSO FORECAST: http://www.cpc.ncep.noaa.gov/products/precip/CWlink/ENSO/total.html NINO 3.4 INITIAL TIME 3 2003 PROJECTION FRACTION BELOW NORMAL ABOVE AMJ 1 0.039 0.372 0.589 MJJ 2 0.066 0.446 0.488 JJA 3 0.126 0.494 0.380 … JFM 9 0.343 0.434 0.243 FMA 10 0.318 0.438 0.244 FORECAST USING CURRENT CPC Nino 3.4: Example – ElNino with 8.5 month lead (forecast for JFM 2004):
Utilized CPC Methods of Downscaling – COMPOSITES – level 3 To obtain a smooth distribution we can use resampling, which allows 93 = 729 different combinations of the months in each season. To better represent extremes in the distribution we sample with replacement using boot strapping technique. X X X X X X X X X X X X
Utilized CPC Methods of Downscaling – COMPOSITES – level 4 DJF North Dakota Temp (°C) The trend should not be removed arbitrarily. Hinge, for example, explains climate changes during the last decades. 11-year Moving Average (MA) explains decadal variations in climate.
WR NEW LOCAL CLIMATE PRODUCTS Where do we go… EXPECTED OPERATIONAL FUNCTIONS: REGIONAL CSPM 1. POE downscaling 1.1. Developing the translation equations for 87 sites (completed) 1.2. Tests of the equations (2003-2004) 1.3. Monthly coordination of local product release (starting 2005) 1.4. Annual update of the equations (starting 2005) 2. Composites 2.1. Coordination of Composites products existing or released in the local offices 2.2. Developing Composites for 87 sites (2003-2004) 2.3. Hind cast test of the composites (2003-2004) 2.4. Monthly coordination of local product release (starting 2005) 2.5. Annual update of the composites (starting 2005)
WR NEW LOCAL CLIMATE PRODUCTS Where do we go… EXPECTED OPERATIONAL FUNCTIONS: WFO CSFP 1. POE downscaling: 1.1. Selection of sites within WFO CWA for downscaling (completed) 1.2. Delivering on monthly basis seasonal outlooks for selected sites within WFO CWA (starting in FY05) 1.3. Verification of the previous month forecasts (starting in FY05) 2. Composites: 2.1. Keeping self updated on climate variability mode status (starting in October 2003) 2.2. Developing composites local studies (optional) 2.3. Release of monthly and seasonal outlooks for selected sites within each WFO CWA (starting in 2005) 2.4. Verification of the Composites forecasts (starting in 2005) 3. Public outreach on these new products
MESSAGES TO TAKE HOME • THERE ARE NO NWS CONSISTENTLOCALCLIMATE PRODUCTS AVAILABLE NOW • DOWSCALING CAN BE USED AS A TOOL FOR LOCAL CLIMATE PRODUCTS • THE LOCAL CLIMATE PRODUCT SHOULD BE CONSISTENT WITH THE NATIONAL WEATHER SERVICE PRODUCTS (CPC) • CPC METHODS COULD BE USED IN DEVELOPING SUCH LOCAL CLIMATE PRODUCTS • IN DEVELOPING OF DOWNSCALING AT LEAST THREE NWS ENTITIES SHOULD BE INVOLVED: REGIONAL OFFICE, CSD, AND CPC