Download
1 / 41
420 likes | 630 Vues
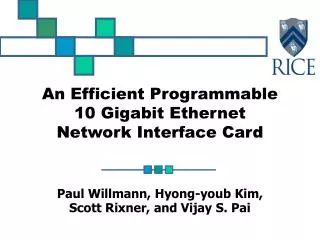
An Efficient Gigabit Ethernet Switch Model for Large - Scale Simulation. Dong (Kevin) Jin. Overview and Motivation. Gigabit E thernet High bandwidth (1Gb/s) Build large-scale networks with many applications Packet delay and loss mainly caused by switches. Data Aggregator. …. Ethernet

E N D
An Efficient Gigabit Ethernet Switch Model for Large-Scale Simulation Dong (Kevin) Jin
Overview and Motivation Gigabit Ethernet • High bandwidth (1Gb/s) • Build large-scale networks with many applications • Packet delay and loss mainly caused by switches
Data Aggregator … Ethernet Switch . . . … Relay … Overview and Motivation Use simulation to study applications on large-scale Gigabit Ethernet Switch Model • Fast simulation speed • Accurate delay and loss
Existing Switch Models • Detailed models (OPNET, OMNet++) • Model internal details • Different models for different switches • High computational cost • Simple Queuing Model (Ns-2, DETER) • Simple FIFO queue • One model for everything • Queuing model based on data collected from real switch [Roman2008] [Nohn2004] • One model, multiple queues • Model parameters derived from experimental data
Detailed Model Simple Queue Model Slow Fast Simple Queue Model Detailed Model More Accurate Less accurate Switch Model Expected Model Simulation Speed (Scalability) Expected Model Accurate delay/loss (reliability, real-time) Approach: Black-box Switch Model • No internal detail • Build delay/loss model based on data-in and data-out • Based on experimental data from real switches (device-specific parameters)
Model Design Approach 2. Build Analytical model 3. Build RINSE model 1. Perform Experiments on real switch 4. Evaluate Simulation Speed and Accuracy
Model Design Approach 2. Build Analytical model 3. Build RINSE model 1. Perform Experiments on real switch 4. Evaluate Simulation Speed and Accuracy
Experiment • Data sequence to collect • One-way delay in switch • Packet loss pattern in switch • Challenges in Gigabit Environment • High bit rate (1Gb/s) - lossless capture at line rate • Small delay in switch (s) - accurate timestamp
NetFPGA Card 1 2 3 4 Experiment Setup • Constant Bit Rate UDP flows • Time_2 - Time_4 = delay per packet in switch • Hardware Timestamp (10 ns) • Problem: capture only about 2000 packets without a miss at 1Gb/s Input pcap Time 2 Time 4 switch
Preliminary Experimental Results - Packet Delay (High Load) • Performance varies about 100 times • One model not enough for all switches • Have to build model based on experimental data flow 1 1 2 Flow1: Mean Delay Vs Sending Rate (packet size = 100 Bytes) { 3 4 Background traffic 5 6 7 8
A Packet Loss Sample Pattern 3COM 0 - received 1 - lost Preliminary Experimental Results- Packet Loss • Loss rate • NetGear 0.4% • 3COM 0.6% • Strong autocorrelation exists among neighboring packets
Model Design Approach 2. Build Analytical model 3. Build RINSE model 1. Perform Experiments on real switch 4. Evaluate Simulation Speed and Accuracy
e.g. K=2 00 01 10 11 Packet Loss Model • Goal • Fast simulation speed • Accurate average loss rate • Accurate autocorrelation • Existing Model - Kth Order Markov Chain • Next state depends on previous K packets • 2^K states
A Packet Loss Sample Pattern 0 - received 1 - lost state 3 state 1 state 2 Packet Loss Model • State type • 1 - long burst of 0s • 2 - short burst of 0s • 3 - burst of 1s • Next state depends on • Current state • #successive packets already in the current state • Less states than Kth order Markov Chain Model
Delay Model • Goal: generate a sequence of delays with • Fast simulation speed • Same distribution as observed • Same autocorrelation as observed • Conditional distribution of multivariate Gaussian is still Gaussian • The next delay generated from previous N delays • Observed delay sequence: Y(t) ~ N(0, 1) covariance coefficient matrix of Y(t) generated delay sequence: Z(t) ~ N(0,1) with same • Computational efficient
Delay Model - Apply to Empirical Data If the empirical delay distribution X(t) is not Gaussian? • Transform X(t) to Y(t) ~ N(0,1) through CDF [F(X) = G(Y)] • Compute of Y(t), and Z(t) ~ N(0,1) • Transform Z(t) back to W(t), opposite to (1)X(t) - observed delay sequenceW(t) - generated delay sequence
Summary • Need an efficient switch model to study applications on large-scale gigabit Ethernet • A black-box model with focus on • Fast simulation speed • Accurate delay and loss • Experimental results justified our approach Experiment Analytical model Simulation model Evaluation
Ongoing Work • Experiment • Collect long data traces with Endace DAG cards • Model • Refine model based on long data traces • Correlation between delay and loss • Evaluation • Simulation speed: compare our model with other models • Accuracy: compare generated data with real data traces
Expanding Our Packet Loss Model Received (long burst) Received (short burst) Lost 1,1 3,1 2,1 1,2 3,2 2,2 1,3 3,3 2,3 . . . . . . . . . 3,N 1,M 2,K
Conditional Distribution of Gaussian • Same autocorrelation and distribution • Computational efficiency conditional distribution for multivariate Gaussian where
CDF • X • W Delay Model Result - CDF X(t) - observed delay seq Y(t) ~ N(0,1) - transformed from X(t) Z(t) ~ N(0,1) - same as Y(t) W(t) - output, transformed from Z(t) Delay (s)
Delay Model Result - Autocorrelation Lag X(t) - observed delay seq Y(t) ~ N(0,1) - transformed from X(t) Z(t) ~ N(0,1) - same as Y(t) W(t) - output, transformed from Z(t) Autocorrelation Table
Delay Model Details Conditional distribution for multivariate Gaussian Autocorrelation, matrix
1 2 3 4 5 6 7 8 Preliminary Experimental Results - Packet Delay (Low Load) • Delay NOT dependent on sending rate • Sufficient processing power to handle single flow up to 1Gb/s • Model packet delay as a constant Delay Vs Sending Rate (packet size = 100 Bytes)
Experimental Results - Packet Delay (High Load) 3COM - Processor Sharing • No idea about bit rate until sufficient packets passed • Assign max weight at beginning • Passed packets bit rate dertermined weight delay Packet Delay at Beginning of experiment under differenet sending rate (Mb/s)
Experimental Results - Packet Delay (Low Load) • Single flow • Delay NOT depends on sending rate • Sufficient processing power to handle 1Gb/s single flow • Model packet delay as a constant
Switch NIC 1 Sender Port 3 2 5 8 7 1 4 6 Timestamp process Packet capture process Receiver Port NIC 2 Experiment Setup with Software Timestamp • Send to self • Timestamp at NIC driver • NIC to NIC overhead Host
DML Configuration Protocol Graph DNP3 TCP UDP configure SSFNet Socket MODBUS enhance OSPF BGP ICMP SSF [Simulation Kernel] IPV4 Emulation implements Interface 1 Interface N SSF Standard/API MAC MAC … PHY PHY RINSE - Architecture • Large scale network simulation • Incorporates hosts, routers, links, interfaces, protocols, etc • Domain Modeling Language (DML) • A range of implemented network protocols • Emulation support
Experiment Difficulty Accurate timestamp for one-way delay (s resolution) • Software Timestamp • At NIC driver • Large delay generated at end hosts at high bit rate (>500Mb/s) • Hardware timestamp (NetFPGA) • 10 ns resolution • Eliminating end-host delay
Black-Box Testing • RFCs 2544 and 2889 - Guidelines • Describing the steps to determine the capabilities of a router • No discussing on how to create model from measurements • [Hohn 2004] Bridging router performance and queuing theory • Simple queuing model, no loss events, and no interactions among ports • 12 DAG cards synchronized by GPS • [Roman 2007] A black-box router profiler • Software testbed (ns2, Click modular router) • Focus on single UDP flow and multiple TCP flows
Delay Model - Copula • Delay model needs to capture • Marginal distribution of packet delay • Autocorrelation among neighboring packets • Copula Model • Sklar’s theorem: Joint Distribution is characterized by • Marginal distributions of each component • Copula
Gaussian Copula - Result • Gaussian Copula • Given , we can generate the output series {Zt} e.g. for n=3, (Z1, Z2, Z3) Z4, then (Z2, Z3, Z4) Z5,… • Same autocorrelation specific by • Each Zt has the marginal distribution ~ N(0,1) - Standard Gaussian pdf N~(0,1) , - correlation coefficient matrix
[Hohn 2004] [Hohn 2004] Bridging router performance and queuing theory • Simple output FIFO queue • Adding delay based on empirical data before entering the queue • No packet loss • No interactions among ports
[Roman 2008] • [Roman 2008] A Device-Independent Router Model • Multiple queue model • Device-specific parameters derived from experimental data • Focus on accurate queue size, number of servers Input ports Output ports
Existing Packet Loss Model • Kth order Markov Chain [Yajnik 1999] • 2^k states, 2^(k+1) conditional probability • Special case: bernoulli model (k=0), two-state markov Chain (k=1) • Two-state Markov Chain (Gilbert Model) • Extended Gilbert Model
Delay in NS-2 vs Real Data Test case: Low rate TCP, data after slow start Inaccurate packet delay distribution
Head-of-line Blocking Reduce throughput Increase packet reordering
Host B Host A APP APP UDP UDP Switch IP IP Switch Ethernet MAC Ethernet MAC Ethernet MAC Ethernet PHY Ethernet PHY Ethernet PHY RINSE - Switch Model 3 Models in Switch Layer • Our black-box model • Simple output queue model • Flip-coin model • Expected Simulation Time on a chain of switches (about 10-25 routers): • complex queuing model > simple output queuing model > our black-box model ≥ coin model