Download
1 / 18
180 likes | 265 Vues
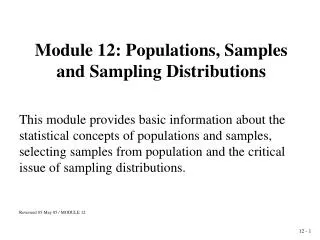
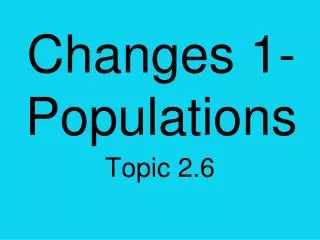
Explore and analyze the years taught by math teachers at Carrollton High School to understand population metrics and sample comparisons. Calculate statistics such as mean, mode, median, quartiles, and standard deviation for both the original population and sample data.

E N D
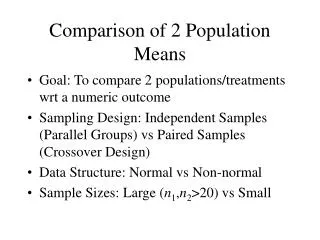
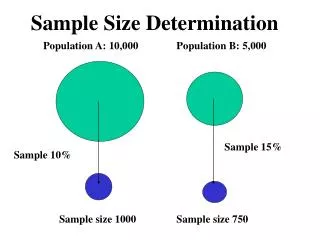
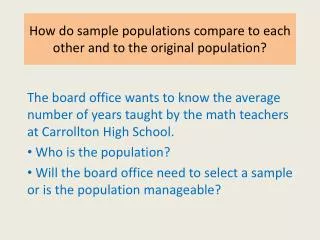
How do sample populations compare to each other and to the original population? The board office wants to know the average number of years taught by the math teachers at Carrollton High School. Who is the population? Will the board office need to select a sample or is the population manageable?
How do sample populations compare to each other and to the original population? Number of years taught by math teachers at Carrollton High School: 1, 1, 2, 3, 5, 8, 9, 10, 24, 28 Find: Mean, Mode, Median, Lower Quartile, Upper Quartile, Range, Interquartile Range, and standard deviation of the population
How do sample populations compare to each other and to the original population? Number of years taught by math teachers at Carrollton High School: 1, 1, 2, 3, 5, 8, 9, 10, 24, 28 Now let’s do some deeper thinking. If there are no personnel changes for the next two years, list the new values for the population. Find the new Mean, Mode, Median, Lower Quartile, Upper Quartile, Range, Interquartile Range, and standard deviation of the new population
How do sample populations compare to each other and to the original population? Listed above is a population of 40 EOCT scores for Math 2 students. Let’s take some samples and see how they compare to the original population.
How do sample populations compare to each other and to the original population? Sample 1: 67, 70, 72, 73, 77, 78, 80, 80, 82, 91 Sample 2: 71, 73, 76, 80, 80, 88, 93, 93, 95, 97 Sample 3: 76, 77, 78, 80, 81, 83, 92, 93, 95, 97 Find Mean, Mode, Median, Range, and standard deviation for the sample you are assigned
How do sample populations compare to each other and to the original population?
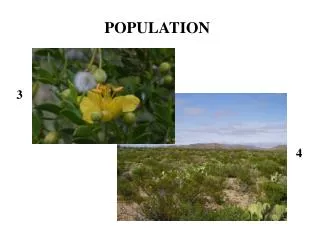
Why do we have a normal curve? Have you ever seen a 2 foot grey squirrel? 18 inches is average How long does a red-tailed hawk live? 16.5 years is average How many hours a week does the average U.S. employee work? 50 hours is average How fast does the average person walk? 3 mph is average
Why do we have a normal curve? Most of the data we collect from biological sources or naturally occurring phenomena when graphed gives a “bell-shaped” curve. We call it the NORMAL CURVE and the data it represents is said to be normally distributed.
Why do we have a normal curve? For normally distributed data, the mean divides the data so that half is below the mean and half is above the mean.
Why do we have a normal curve? Also, for normally distributed data, the standard deviation can be used to further divide the data.
How does the normal curve help us make predictions about the population? A data set is normally distributed and has a mean of 70, if the standard deviation for the data is 2, then the normal curve is labeled as:
How does the normal curve help us make predictions about the population? On this normal curve, what percent of the data is between: 68 and 72 66 and 74 64 and 76
How does the normal curve help us make predictions about the population? On this normal curve, what percent of the data is between: 70 and 72 64 and 68 above 76
How does the normal curve help us make predictions about the population? Outlier—data that appears to deviate markedly from other members of the sample in which it occurs. For our purposes, any data that falls beyond 2 standard deviations from the mean can be considered an outlier on the normal curve.
How does the normal curve help us make predictions about the population? The normal curve allows us to quickly make predictions about members of a normally distributed population! Let’s take a look at some normal curves: Normal Curve Applet
Normal Curve Example: • The average score on an AP Gov test was a 78, the standard deviation was 3. • A) Draw the normal curve to represent this scenario.