Download
1 / 8
80 likes | 200 Vues
This article explores key methods to enhance the fidelity of regression models. We delve into the concept of surrogate models and how they can be characterized by coefficients of determination, prediction accuracy measures, and error assessments. We emphasize the importance of cross-validation for estimating predictive error by dividing data into groups, particularly in linear regression contexts. Additionally, we compare various error metrics and discuss assumptions related to linear regression models, aiming to offer insights into minimizing approximation errors and achieving optimal model performance.

E N D
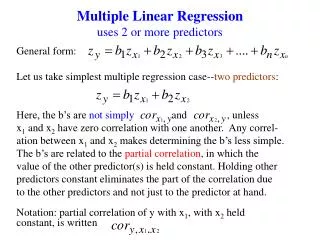
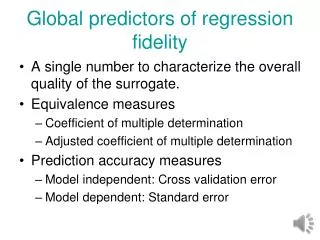
Global predictors of regression fidelity • A single number to characterize the overall quality of the surrogate. • Equivalence measures • Coefficient of multiple determination • Adjusted coefficient of multiple determination • Prediction accuracy measures • Model independent: Cross validation error • Model dependent: Standard error
Linear Regression • Surrogate is linear combination of given shape functions • For linear approximation • Difference (error) between data and surrogate • Minimize square error • Differentiate to obtain
Coefficient of multiple determination • Equivalence of surrogate with data is often measured by how much of the variance in the data is captured by the surrogate. • Coefficient of multiple determination and adjusted version
R2 does not reflect accuracy • Compare y1=x to y2=0.1x plus same noise (normally distributed with zero mean and standard deviation of 1. • Estimate the average errors between the function (red) and surrogate (blue). R2=0.9785 R2=0.3016
Cross validation • Validation consists of checking the surrogate at a set of validation points. • This may be considered wasteful because we do not use all the points for fitting the best possible surrogate. • Cross validation divides data into nggroups. • Fit the approximation to ng -1 groups, and use last group to estimate error. Repeat for each group. • When each group consists of one point, error often called PRESS (prediction error sum of squares) • Calculate error at each point and then present r.m.s error • For linear regression can be shown that
Model based error for linear regression • The common assumptions for linear regression • The true function is described by the functional form of the surrogate. • The data is contaminated with normally distributed error with the same standard deviation at every point. • The errors at different points are not correlated. • Under these assumptions, the noise standard deviation (called standard error) is estimated as • is used as estimate of the prediction error.
Comparison of errors • For the example in slide 4 of y=x plus the Gaussian noise the fit was=0.5981+0.9970x. • The noise came from randn, set to zero mean and unit standard deviation. However it had a mean of 0.552 and a standard deviation of 1.3. • The normal error is calculated as 1.32 and the cross validation (PRESS) error as 1.37. • With less data, the differences will be larger. • The actual error was only about 0.6 because the large amount of data filtered the noise.
Problems • The pairs (0,0), (1,1), (2,1) represent strain (millistrains) and stress (ksi) measurements. • Estimate Young’s modulus using regression. • Calculatethe error in Young modulus using cross validation both from the definition and from the formula on Slide 5. • Repeat the example of y=x, using only data at x=3,6,9,…,30. Use the same noise values as given for these points in the notes for Slide 4.