Enhancing Education Through Data: The Path to Academic Success
Learn how data informs decision-making at all levels of the organization, reveals areas for improvement, and ensures adequate yearly progress. Explore historical results, performance measurements, and changes in state testing to drive student success.

Enhancing Education Through Data: The Path to Academic Success
E N D
Presentation Transcript
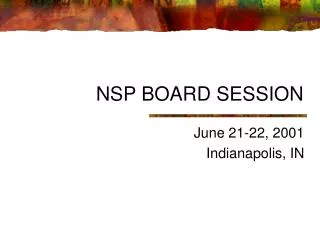
NORTHSHOREboard study session Assessment and Testing Performance Nancy Young Interim Director of Assessment and Interventions Brandon Lagerquist Student Learning Data Analyst
Using Data • To inform instruction • To make decisions at all levels of the organization • To dig deeper to reveal areas for improvement
2009 WASL Results • 4th grade historical results • 7th grade historical results • 10th grade historical results
Adequate Yearly Progress • NCLB Annual Accountability Measure • District and school performance measured across multiple sub-groups. • Which sub-groups are measured varies drastically dependent upon group size.
AYP Status Over 4 YearsNumber of NSD schools with 1 or more “NO” cells
Changes in State Testing • Name of system changed to: Washington Comprehensive Assessment Program (WCAP). • GRADES 3-8 TEST: Measurements of Student Progress (MSP) • Reading, Writing, and Science use same item banks as WASL • HIGH SCHOOL TEST: High School Proficiency Exams (HSPE) • Reading, Writing, Math, and Science use same item banks as WASL. • All CAA and CIA Options still exist.
Changes In State Testing • Testing offered on-line in Spring 2010 • Initially, only open to grades 6-8. • Available to all grades in 2012. • Shorter Tests • Each test designed to be completed in one day • Time to complete varies from one to two hours. • Different Testing Window May 12-28 for paper/pencil and May 3 – June 4 for on-line testing.
Moving Forward • Common and consistent district-level assessments • Comprehensive assessment plan at elementary • Assessment literacy professional development • On-line MSP at TJH and Sunrise spring 2010