Download
1 / 1
10 likes | 134 Vues
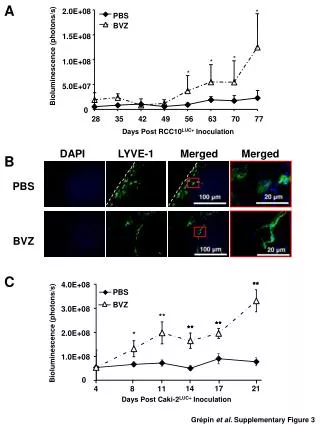
This study investigates bioluminescence (in photons/s) in RCC10LUC+ and Caki-2LUC+ cell lines post-inoculation with various PBS and BVZ concentrations. Data were collected at multiple time points (0.28 to 77 days) to assess the efficacy of the inoculation. Supplementary Figure 3 illustrates the merged results from DAPI and LYVE-1 staining, providing insight into cellular responses over time. The research presents valuable findings for understanding tumor behavior and treatment effects within these models.

E N D
A * 2.0E+08 PBS BVZ 1.5E+08 * * 1.0E+08 Bioluminescence (photons/s) * 5.0E+07 0 28 35 42 49 56 63 70 77 Days Post RCC10LUC+ Inoculation DAPI LYVE-1 Merged Merged B PBS BVZ C 4.0E+08 PBS BVZ 3.0E+08 ** * 2.0E+08 Bioluminescence (photons/s) 1.0E+08 0 4 Days Post Caki-2LUC+ Inoculation Grépin et al. Supplementary Figure 3