Statistical Analysis of Radon Detector Readings and Pipeline Liner Tensile Strength
This report presents a statistical analysis of two separate problems. The first involves testing if the mean reading of radon detectors is equal to 100 pCi/L using a one-sample t-test based on 12 detector readings. The second problem examines tensile strength differences in pipeline liners with and without a fusion process, utilizing a two-sample t-test. Both analyses include confidence intervals and detailed statistics regarding population means and variances, providing insights into the efficacy of proposed rehabilitation technologies.

Statistical Analysis of Radon Detector Readings and Pipeline Liner Tensile Strength
E N D
Presentation Transcript
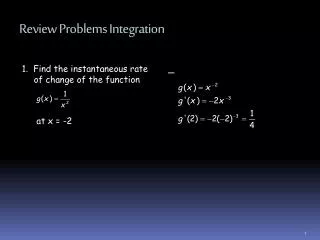
Review Problems Stat 701: Illustrations
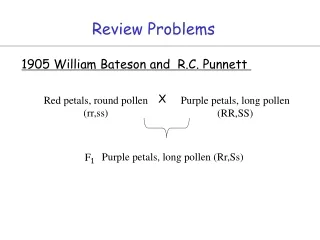
One-Sample Problem A sample of 12 radon detectors of a certain type was selected, and each was exposed to 100 pCi/L of radon. The resulting readings were as follows: 105.6, 90.9, 91.2, 96.9, 96.5, 91.3, 100.1, 105.0, 99.6, 107.7, 103.3, 92.4 Problem: To test that the population mean reading is 100, and to construct a confidence interval for this population mean. Summary: n = 12, Xbar = 98.375, S = 6.1095
Two-Sample Problem The deterioration of many municipal pipeline networks across the country is a growing concern. One technology proposed for pipeline rehabilitation uses a flexible liner threaded through existing pipe. The following data represents the tensile strength (psi) of liner specimens for when a certain fusion process was used and when this process was not used. The study intended to show that using the fusion process increased the mean tensile strength.
Data • No Fusion: 2748, 2700, 2655, 2822, 2511, 3149, 3257, 3213, 3220, 2753 • Fused: 3027, 3356, 3359, 3297, 3125, 2910, 2889, 2902
Summary of Statistics Descriptive Statistics Variable N Mean Median StDev SE Mean NoFusion 10 2902.8 2787.5 277.3 87.7 Fused 8 3108.1 3076.0 205.9 72.8
Problems to Demonstrate • Testing Equality of Population Means Using T-Test • Confidence Interval for the Difference of Population Means • Testing Equality of Population Variances • Confidence Interval for the Ratio of Population Variances
Testing Equality of Means(Equal Variances) Two Sample T-Test and Confidence Interval Two sample T for NoFusion vs Fused N Mean StDev SE Mean NoFusion 10 2903 277 88 Fused 8 3108 206 73 95% CI for mu NoFusion - mu Fused: ( -455, 45) T-Test mu NoFusion = mu Fused (vs <): T = -1.74 P = 0.050 DF = 16 Both use Pooled StDev = 249
Testing Equality and CI of Means(Unequal Variances) Two Sample T-Test and Confidence Interval Two sample T for NoFusion vs Fused N Mean StDev SE Mean NoFusion 10 2903 277 88 Fused 8 3108 206 73 95% CI for mu NoFusion - mu Fused: ( -448, 38) T-Test mu NoFusion = mu Fused (vs <): T = -1.80 P = 0.046 DF = 15