Investment Analysis
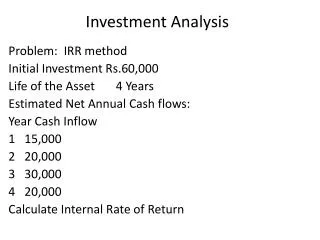
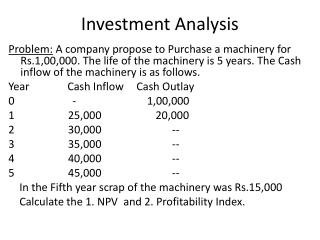
Investment Analysis. Problem: A company propose to Purchase a machinery for Rs.1,00,000. The life of the machinery is 5 years. The Cash inflow of the machinery is as follows. Year Cash Inflow Cash Outlay 0 - 1,00,000

Investment Analysis
E N D
Presentation Transcript
Investment Analysis Problem: A company propose to Purchase a machinery for Rs.1,00,000. The life of the machinery is 5 years. The Cash inflow of the machinery is as follows. Year Cash Inflow Cash Outlay 0 - 1,00,000 • 25,000 20,000 • 30,000 -- • 35,000 -- • 40,000 -- • 45,000 -- In the Fifth year scrap of the machinery was Rs.15,000 Calculate the 1. NPV and 2. Profitability Index.
Investment Analysis Solution: Year Cash P.V.Factor Present Inflow Value of Cash inflow • 25,000 0.909 22,725 • 30,000 0.826 24,780 • 35,000 0.751 26,285 • 40,000 0.683 27,320 Out lay calculation • 45,000 1,00,000+ (20,000x.909) + 15,000 0.621 37,260 1,00,000 +18,180 --------------- 1,18,180 Total Present Value of Inflow1,38,320 Total Present Value of Outlay1,18,180 -------------- 20,140 - NPV --------------
Investment Analysis Total Present Value of Cash Inflow Profitability Index: ------------------------------------------------- Total Present Value of Cash Outlay 1,38,320 Profitability Index = ---------------- = 1.17 or 117 1,18,180
Break Even Point • 1. From the following particulars, calculate the break even point • Variable cost per unit = Rs.12 • Fixed expenses = Rs.60,000 • Selling price per unit = Ra.18 • Solution: • BEP (Units) = Fixed cost • Contribution per unit • (Selling Price – Variable Cost = Contribution) • Rs.18 – Rs.12 = 6) • Rs.60,000 / Rs.6 = 10,000 units • B.E.P. Sales = 10,000 x Rs.18 = Rs.1,80,000
BEP • . A Company estimates that next year it will earn a profit of Rs.50,000. The budgeted fixed costs and sales are Rs.2,50,000 and Rs.9,93,000 respectively. Find out the break-even point for the company. • Solution : • B.E.P. (in units) = F x S • Contribution • Contribution = S – V = F + P • F + P = Rs.2,50,000 + Rs.50,000 = Rs.3,00,000 • B.E.P. Sales = 2,50,000 x 9,93,000 • 3,00,000 • = Rs.8,27,500
BEP • 3. From the following particulars, find out the selling price per unit if B.E.P. is to be brought down to 9,000 units. • Variable cost per unit Rs.75 • Fixed expenses Rs,2,70,000 • Selling price per unit Rs.100
BEP Solution: Let us assume that the contribution per unit at B.E. sales of 9,000 is x • B.E.P. = Fixed Cost • Contribution per unit • Contribution per unit is not known. Therefore • 9,000 units = 2,70,000 • x • 9,000 x = 2,70,000 • x = 30 • Contribution is Rs.30 per unit, in place of Rs.25. Therefore, the selling price should have been Rs.105 i.e. Rs.75 + Rs.30.
Ratio Analysis Problem: • Liabilities • Share Capital 2,00,000 • Profit & Loss account 30,000 • General Reserve 40,000 • 12% Debentures 4,20,000 • Sundry Creditors 1,00,000 • Bills Payable 50,000 ----------------- 8,40,000
Ratio Analysis Problem: • Assets • Land & Buildings 1,40,000 • Plant & Machinery 3,50,000 • Stock 2,00,000 • Sundry Debtors 1,00,000 • Bills Receivable 10,000 • Cash at Bank 40,000 ---------------- 8,40,000
Ratio Analysis • Calculate: • Current Ratio • Quick Ratio • Inventory to Working capital • Debt to Equity Ratio • Proprietary Ratio • Capital gearing Ratio • Current Assets to Fixed assets
Ratio Analysis • Solution: • (i) Current Ratio = Current Assets • Current Liabilities • Current Assets = Stock + Sundry Debtors + Bills Receivable + Cash at Bank • = (2,00,000+1,00,000+10,000+40,000) = Rs 3,50,000 • Current Liabilities = Sundry Creditors + Bills Payable • = (1,00,000+50,000) = Rs.1,50,000 • Current Ratio = 3,50,000 = 2.33 :1 • 1,50,000
Ratio Analysis • (ii) Quick Ratio = Liquid Assets • Current Liabilities • Quick Assets = Sundry Debtors + Bills Receivable + Cash at Bank • = (1,00,000+10,000+40,000) = Rs 1,50,000 • Quick Ratio = 1,50,000 = 1:1 • 1,50,000
Ratio Analysis • (iii) Inventory to Working capital = Inventory • Working Capital • Inventory = Stock = Rs.2,00,000 • Working capital = Current Assets – Current Liabilities • = Rs.3,50,000 – Rs.1,50,000 = Rs.2,00,000 • Inventory to Working capital = 2,00,000 = 1:1
IV. Debt to Equity Ratio = Long Term Debt • Shareholders’ Fund • Long Term Debt = Debentures = Rs.4,20,000 • Shareholders’ Fund = Capital + Reserves and Surplus • = Rs.2,00,000+30,000+40,000 = Rs 2,70,000 • Debt to Equity Ratio = 4,20,000 = 1.56: 1 • 2,70,000 • (or) Debt to Equity Ratio = Long Term Debt • Shareholders’ Fund + Long Term Debt • = 4,20,000 = 0.6: 1 • 6,90,000
(V) Proprietary Ratio = Shareholders’ Fund • Total Assets • = 2,70,000 = 0.32:1 • 8,40,000 • (vi) Capital gearing Ratio = Fixed interest bearing securities • Equity Share capital • Fixed interest bearing securities = only debentures = Rs.4,20,000 • Capital gearing Ratio = 4,20,000 = 2.1:1 • 2,00,000
Ratio Analysis • (vii) Current Assets to Fixed assets = Current Assets • Fixed Assets • = 3,50,000 = 0.71:1 • 4,90,000