Download
1 / 13
130 likes | 296 Vues
The Model of Production Possibilities. This is a basic model designed to highlight the impact of scarcity on an economic system. The model of production possibilities.

E N D
The Model of Production Possibilities This is a basic model designed to highlight the impact of scarcity on an economic system
The model of production possibilities One way to illustrate the notion of opportunity cost is to study the model of production possibilities. In this model of production possibilities we assume: 1) Only two goods are produced at a given time – pizza and chapter notes. 2) There are only so many resources available for production and they are all fully employed; 3) There is a given state of technology; 4) Resources are used to the fullest - technical or productive efficiency is achieved – for now take this to mean that resources are used in such a way that the most output is obtained from them.
the ppc model Let’s say we have 4 people in the economy and with the resources available each person can produce the given amount below of pizza OR typed chapter notes in a one hour time frame. The data is Blanky à1 pizza or 1 chapter Gleeper à 1 pizza or 2 chapters Koch à 1 pizza or 3 chapters Theman à 1 pizza or 4 chapters. Note: if all 4 make pizza, then only 4 pizza can be made. If all 4 make chapter notes, then 10 chapter notes can be made.
the ppc model Consider the situation where all are making chapter notes. We then have 10 chapters made and no pizza. Another possibility is that we want 1 pizza made and then all the chapter notes we can get. Who should make the first pizza? Well, if we want the most from our resources (follow the assumptions of the model), then Blanky should make the first pizza because he only gives up one set of chapter notes. So, another production possibility is 1 pizza and 9 chapter notes. Using similar logic you will see on the next screen the production possibilities for the economy.
the ppc model pizza chapter notes 0 10 1 9 2 7 3 4 4 0 Do you know who made the 2nd, 3rd and 4th pizzas? Let’s put this data in a graph on the next screen. (By the way, this table should be read as we can have 0 pizza and 10 chapter notes, or 1 pizza and 9 chapter notes, and so on.)
the ppc model in a graph chapter notes Each point is an ordered pair with pizza first and then chapter notes. (1, 9) (2, 7) (3, 4) (0, 10) Hey, I have ppc in my notes. The author talks about the graph as a production possibility frontier. I used curve for frontier, thus the c in ppc. (4, 0) pizza
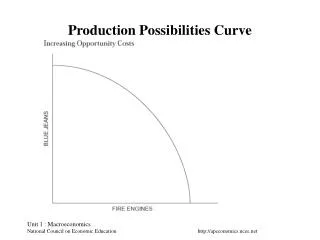
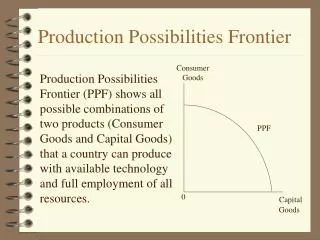
Model of PP When the resources available in the economy are employed and used to the fullest, the level of production in the economy can be anywhere along the production possibility curve - PPC. Things to note about the PPC: 1) The curve shows the maximum output the economy can produce; 2) At any point on the curve, the only way more of one good can be obtained is if less of the other good is produced - this is the idea of a trade-off (the value of the trade-off is the opportunity cost);
3) The curve is bowed out. The reason for the bowed out shape is that all resources are NOT perfectly adaptable to the production of both items. Some resources are better suited to making one item over the other. This is the law of increasing relative cost. (This is also part of the table we saw before.)
Model of PP To see this last point more clearly, think about being in the upper left of the graph. Then as one pizza is produced in the economy, the resources that leave chapter notes are relatively not very good in chapter note production and so not many chapters are sacrificed. But, as even more pizzas are made, good chapter note resources leave and thus chapter production drops by larger and larger amounts. You could say a corollary to the principle of opportunity cost is the notion of increasing relative (opportunity) cost that we see in this example. In making pizza, the cost of chapter notes forgone increases the more pizza that is made.
Model of PP How much did the first pizza cost in terms of chapter notes forgone? Just 1 (Chapter notes went from 10 to 9). How much did the second pizza cost in terms of chapter notes forgone? 2 (Chapter notes went from 9 to 7). Does each pizza cost the same to make? We just showed the answer to this question to be NO! The cost of making pizza increases because with each additional pizza not only do we give up chapter notes, but an increasing amount of chapter notes is given up. What do the third and fourth pizzas cost?………………..
Economic growth Economic growth is a situation where more can be produced in an economy. In our model of production possibilities we assumed that resources and the state of technology were fixed. But if these things actually change in that we get more of them, then the curve shifts out. This would be an indication of economic growth. On the next slide lets focus on two special kinds of output - consumption goods and capital goods.
Special PPC Capital N M L Consumption Is this graph more like figure 1.4 or figure 1.5 in the book?
Special PPC When we recognize that capital is a resource that is man made we recognize we have a trade-off between present and future consumption. As we compare points N, M and L on the previous screen we see point N has the most capital, but the least consumption. The more we move to point N, the less current consumption we have, the more future consumption we can have because with more of the resource capital, the more the curve would shift out. Note: we could debate all day, probably, where we should be on the curve, but that is not the point at this time!