Download
1 / 65
650 likes | 682 Vues
Discover the study-work tradeoff and the concept of production possibilities in economics. Learn the importance of balancing study and work time for optimal results in your academic pursuits. Explore the production possibilities curve and how economic growth influences resource allocation.

E N D
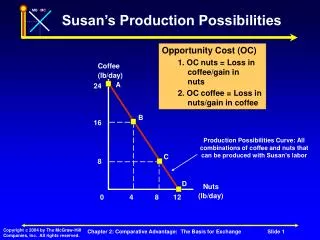
Production Possibilities While in school, you allot yourself a certain period of time to study. A. Given a 70 hour week ( 7 days, 10 hours a day), you can 1. study all the time = possibly a very dull person
Production Possibilities 2. play all the time = possibly a very ignorant person 3. do both, one at the expense of the other alternative such that:
Production Possibilities a. You are a well rounded person. b. You are a little dull at a party, but you are all right. c. You are a little ignorant at a party, but you are all right.
The Study:Work Tradeoff B. Assume that you are only taking two courses: Livestock Management and Agricultural Economics. 1. Also assume that you have a part time job, and only have 10 hours a week allotted to study for both subjects outside of class.
The Study:Work Tradeoff 2. Your grade in each course will be a function (dependent upon) of how many hours you study each subject.
The Study:Work Tradeoff 3. Assume if you study: 0 hrs for economics: get F in econ. , A in livestock 2.5 hrs for economics: get D in econ., B in livestock
The Study:Work Tradeoff 5.0 hrs for economics: get C in econ., C in livestock 7.5 hrs for economics: get B in econ., D in livestock 10.0 hrs for economics: get A in econ., F in livestock
A picture of the trade off above would look like this: E(grade) Livestk. 10 hrs 10 hrs E(grade) Econ
The graph above was prepared from the following data set. X Y (hrs on econ) (hrs on lstk) (F) 0 10.0 (A) (D) 2.5 7.5 (B) (C) 5.0 5.0 (C) (B) 7.5 2.5 (D) (A) 10.0 0 (F)
Now assume you cut back on work and you now have 20 hrs a week to study, what will happen ?
E(grade) Livestk. 10 hrs 10 hrs E(grade) Econ
20 hrs E(grade) Livestk. 10 hrs 10 hrs E(grade) Econ 20 hrs
THE PRODUCTION POSSIBILITIES CURVE: Lets look at an economy and break down the commodities into two commodity groups. 1. Agricultural goods & services 2. Non-agricultural goods & services
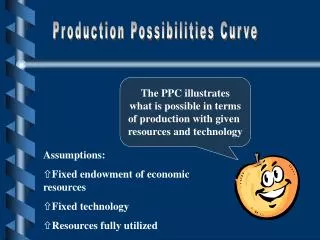
THE PRODUCTION POSSIBILITIES CURVE: Lets make some initial assumptions associated with the PPC 1. All resources are utilized and are fixed. 2. Technology is not changing. 3. Resources are not perfectly mobile. 4. There are only two commodities.
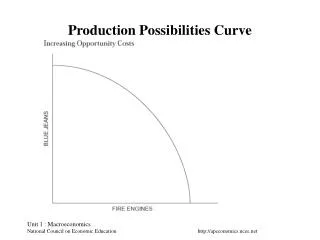
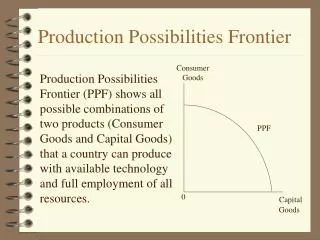
We can now illustrate the PPC curve: $ of Ag. Goods per year unattainable attainableproduction frontier $ Non-Ag. goods per year
The PPC Curve • Vertical axis = $ value of agricultural goods & services produced per year. • Horizontal axis = $ value of non-ag. goods & services produced per year.
The PPC Curve • $ value = the sum of the price of each commodity produced times the quantity of each commodity produced. • In our example, the $ value of ag. goods + $ value of non-ag goods equals gross domestic product (GDP).
The PPC Frontier The PPC frontier shows all the combinations of the two commodities that can just be produced if all resources are fully employed with the technology currently available.
The PPC curve illustrates 3 concepts: (assuming resources are fully employed) Scarcity: This is shown by the unattainable points. Choice: Any of the attainable points are possible.
The PPC curve illustrates 3 concepts: (assuming resources are fully employed) Opportunity cost: This is due to the downward slope of the production possibilities curve. i.e. To get more non-agricultural goods, you must give up some agricultural goods.
An explanation of the negative slope of the PPC: The PPC is bowed out, and slopes down because of the LAW OF INCREASING COSTS: The more of one good the economy produces, the greater the amount of other goods that must be given up (opportunity cost increases at an increasing rate).
Law of Increasing Costs $ Ag. 4 3 2 1 $ Non- Ag.
Law of Increasing Costs As we increased the dollar value of ag. goods and services produced from 3 to 4 units, we had to sacrifice this dollar value of non-ag. goods and services. $ Ag. 4 3 2 1 $ Non- Ag.
Why do costs increase as more and more of one commodity is produced ? • Resources are not easily adaptable to all types of production. (Not Perfectly mobile!!) • It costs more and more to shift not so adaptable non-ag. resources into agricultural production, or visa-versa.
Economic Growth Over time, we would like to see the PPC shift outward. When the PPC shifts outward, the economy has grown and our standard of living is often enhanced. An outward shifting PPC over time illustrates the ECONOMIC GROWTH you here about all the time on TV, and read about in the newspaper.
What can cause the PPC to shift ? • Remember the initial assumptions we made ? They were somewhat constraining, lets begin to relax them. • Remember we assumed that technology and the amount of available resources were fixed or held constant.
Improved Technology • An advancement in technology means more goods and services can be produced with the SAME amount of available resources (PE).
$Ag GoodsHybrid Corn Example $Non-Ag
$Ag Goods Microcomputers $Non-Ag
Advances in technology allow us to increase output with the same or a lessor amount of inputs What about increases in resources themselves?
The production possibilities curve shifts right. For example: Increased labor force due to population growth.
$Ag Goods Increased Labor Force $Non-Ag
Present Mix of Consumer and Capital Goods: The present mix of consumer and capital goods can affect the future economic growth of an economy.
How will the present position on this production possibilities curve affect the future position of the $AG vs. $Non-AG PPC? What if the current position is A? $ Consumer Goods $ Capital Goods Pt. A Pt. B Qty needed to maintain Economy
Point A: The economy has lots of consumer goods and little capital goods. The emphasis is on the short run and not on the long run. A large shift in the $Ag vs. $ Non-Ag production possibilities curve would not be expected. In this case, the economy will have more Consumer good consumption now than at point B, but future Consumer good consumption will be less.
If the investment in capital is less than the depreciation of capital, the PPC could shift inward. $Ag. $ Non-Ag. PPC95 PPC97
Point B: The economy has lots of capital goods and little consumer goods. The emphasis is on the long run and not on the short run. A large shift in the $Ag. vs. $Non-Ag. production possibilities is possible. In this case, the economy will have less present Consumer good consumption now than at point A but future Consumer good consumption will be more.
$ Consumer Goods $ Capital Goods Pt. A Pt. B Qty needed to maintain Economy
In this case, the economy invests heavily in productive capital so it is possible to have lots more Ag and Non-Ag consumer goods in the future. $Ag. $ Non-Ag. PPC97 PPC95
DETERMINANTS of the PPC. 1. Quantity of resources (FOP's) available for society to utilize. a. If resources increasedoutput is increased c.p.
2. Improvements in Physical efficiency (New Technology!, Enhanced Productivity!) a. increase (units of output / units of input) b. If resources are currently fixed, this is one way to shift the PPC outward to achieve economic growth.
3. The current mix of capital and consumer good production. a. If we increase capital good production relative to consumer good productionthis increases one of the FOP's (capital) this increases potential future output.
b. This is the primary reason for investment tax credits and capital gains tax rates.
4. Mobility of resources: a. If we increase (improve) the mobility of resources between the production of different commodities,
-- We decrease the opportunity cost of moving resources from the production of one commodity to the production of another. We take some of the “bow” out of the PPC curve.
b. By reducing the opportunity cost, the potential output of both commodities is increased. $ Ag $ Non-Ag
c. Our economy is more resilient to changes in world economic conditions, --resources are more quickly re-employed if displaced from the production of a particular commodity,
--temporarily unemployed resources are more efficient when re-employed in the production of alternative commodities. --less training or modification is required, therefore their is a lower cost of re-allocating these resources.
d. Which of the four categories of the FOP's is our society most concerned with in the short-run ? -- LABOR -- ENTREPRENEURSHIP OR MANAGEMENT