Download
1 / 12
120 likes | 638 Vues
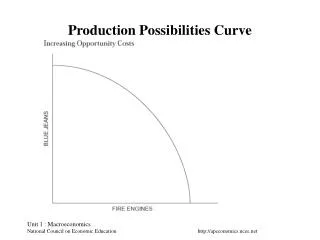
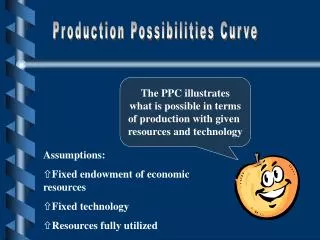
Production possibilities curve. An introduction. Abstractions and Assumptions of a PPC. Compare 2 variables; goods or services Trade-offs or opportunity cost involved All available resources are fully employed All available technology is fully employed

E N D
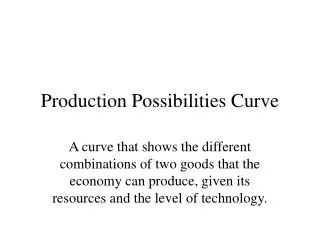
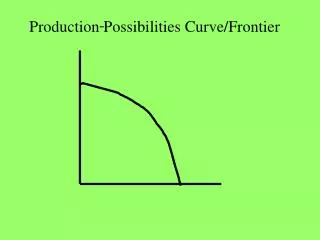
Production possibilities curve An introduction
Abstractions and Assumptions of a PPC • Compare 2 variables; goods or services • Trade-offs or opportunity cost involved • All available resources are fully employed • All available technology is fully employed • Productive efficiency: Resources are employed in the least costly way
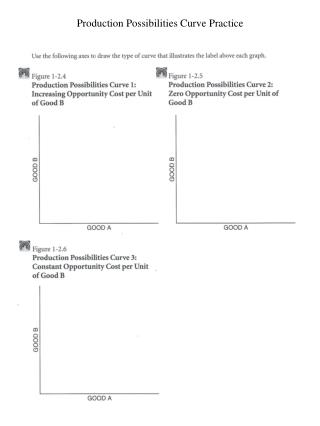
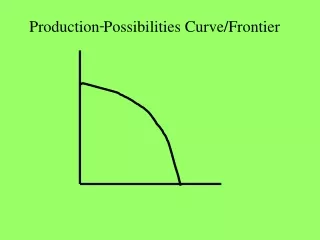
Increasing opportunity cost per unit of good B What type of curve illustrates the label below? Good B Good A
Increasing opportunity cost per unit of good B What type of curve illustrates the label below? Good B Good A
Zero opportunity cost per unit of good B What type of curve illustrates the label below? Good B Good A
Zero opportunity cost per unit of good B What type of curve illustrates the label below? improbable Good B Good A
Constant opportunity cost per unit of good B What type of curve illustrates the label below? Good B Good A
Constant opportunity cost per unit of good B What type of curve illustrates the label below? Good B Good A
Decreasing opportunity cost per unit of good B What type of curve illustrates the label below? Good B Good A
Decreasing opportunity cost per unit of good B What type of curve illustrates the label below? Impossible; not supported by economic theory Good B Good A
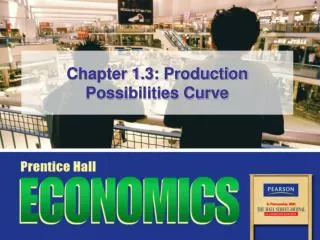
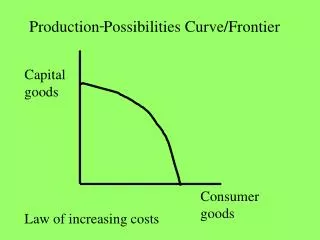
What trade-offs are involved? Why is the PPC concave? What does point (E), inside the PPC illustrate? What is the significance of point (F), outside the PPC? Under what conditions can point F be reached? A 12 F B 10 8 army trucks 6 C E 4 2 D 0 1 2 3 cars
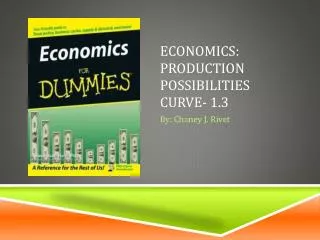
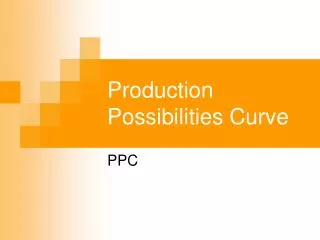
H F G A Moving from point B to point A, could eventually expand the frontier from G,G to H,H B capital goods C E D 0 H G consumer goods