Download
1 / 59
600 likes | 926 Vues
Scarcity, Opportunity Costs, and the Production Possibilities Curve. Scarcity. Scarcity. Resources are scarce You can’t always get what you want so everyone must make choices. Choices can be dependent on money but also time. Why do individuals have to make choices?

E N D
Scarcity, Opportunity Costs, and the Production Possibilities Curve
Scarcity • Resources are scarce • You can’t always get what you want so everyone must make choices. • Choices can be dependent on money but also time. • Why do individuals have to make choices? BECAUSE RESOURCES ARE SCARCE
Scarcity • Resource is anything that can be used to produce something else • lists of the economy’s resources: • land • labor (the time of workers) • capital (machinery, buildings, and other man-made productive assets) • human capital (the educational achievements and skills of workers) (your book calls this entrepreneurial ability)
Scarcity • A resource is scarce when there’s not enough of the resource available to satisfy all the various ways a society wants to use it • Examples are natural resource, human resources (labor, skill, intelligence) and even clean air and water • The scarcity of resources means that society as a whole must make choices • One way to make choices is to allow them to emerge as the result of many individual choices – which is what happens in a market economy
Opportunity Costs • The real cost of an item is its opportunity cost – what you give up in order to get it • The concept of opportunity cost is crucial to understanding individual choice because, in the end, all costs are opportunity costs. Every choice you make means forgoing some other alternative • Some important decisions involve an “either-or” choice • Example: You decide either to go to college or to begin working, you decide whether to take economics or to take something else
Opportunity Costs • But other important decisions involve “how much” choices • Example: you are taking both AP Economics and AP Chemistry, you must decide how much time to spend studying for each
Opportunity Costs • How Much” decisions is a decision to make at the margin – comparing the costs and benefits of doing a little bit more of an activity versus doing a little bit less –known as marginal decisions and the study of which is known as Marginal analysis • Usually in a decision made at the margin, you decision is involving a “trade-off” which is a comparison of costs and benefits
Explicit Costs vs. Implicit Costs • Opportunity Costs is the real cost of something you must give up to get it • When making decisions, it is crucial to think in terms of opportunity cost, because the opportunity cost of an action is often considerably more than the cost of any outlays of money • Opportunity Costs can be broken into two parts: Explicit costs Implicit costs
Explicit Costs is a cost that requires an outlay of money • Implicit Costs, does not involve an outlay of money; instead, it is measured by the value, in dollar terms, of the benefits that are forgone • Example: • EC: an additional year of college requires tuition • IC: an additional year of college includes the income you would have earned in your have taken a job instead
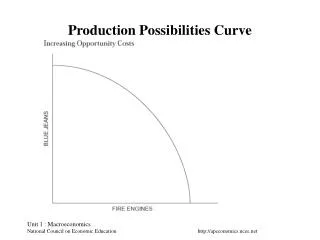
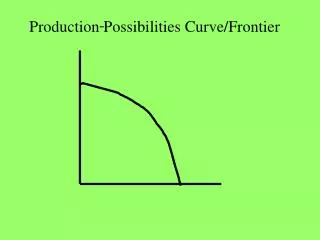
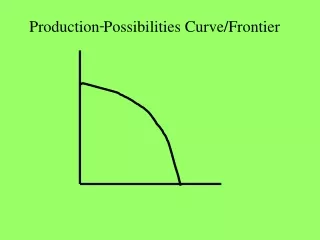
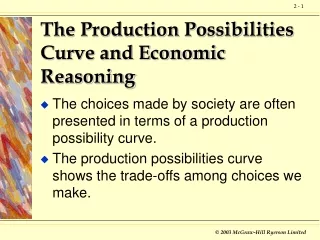
To think about the trade-offs that face any economy (comparing the costs and benefits), economists use the Production Possibilities Curve • The model is used to improve our understanding of trade-offs by considering a simplified economy that produces only two goods
The following graph is a hypothetical production possibilities curve for Tom, a castaway as seen in the movie Cast Away. He must make a trade-off between production of fish and production of coconuts
What is the maximum quantity of fish Tom can catch if he also gathers 9, 15 or 30 coconuts? The frontier – the line in the diagram – shows the maximum quantity of fish Tom can catch during a week GIVEN the quantity of coconuts he gathers, and vice versa. Quantity of coconuts D 30 Feasible and efficient in production Not feasible A 15 B Feasible but not efficient 9 C Production possibility frontier PPF 0 20 28 40 Quantity of fish
Points that lie outside the PPC are hypothetical points that are not feasible Distinction between points INSIDE or ON the PPC: shaded area points inside or on the frontier is feasible Quantity of coconuts D 30 Feasible and efficient in production Not feasible A 15 B Feasible but not efficient 9 C Production possibility frontier PPF 0 20 28 40 Quantity of fish
Efficiency • PPC illustrates the economic concept of efficiency (an economy is efficient if all opportunities to make some people better off without making other people worse off are taken) • Key element of efficiency is that there are no missed opportunities in production – there is no way to produce more of one good without producing less of other goods • As long as Tom is on the PPC frontier, his production is efficient
If an economy is producing at a point on its production possibility frontier, we say that the economy is efficient in production • But…. if Tom was at point C it would be a one-person economy and this is not efficient in production and would be inefficient—producing more of both goods • Example in the economy is when people are involuntarily unemployed, they want to work but are unable to find jobs and this means the economy is not efficient in production because it could be producing more output is these people were employed
PPC helps to clarify what it means for an economy to be efficient in production BUT efficiency in production is only part of what’s required for the economy as a whole to be efficient • Efficiency also requires that the economy allocates its resources so that consumers are as well off as possible – efficiency in allocation • Efficiency for the economy as a whole requires both efficiency in production and efficiency in allocation; to be efficient, an economy must produce as much of each good as it can given the production of other goods, and it must also produce the mix of goods that people wasn’t to consume
Quantity of coconuts D 30 Feasible and efficient in production Not feasible A 15 B Feasible but not efficient 9 C Production possibility frontier PPF 0 20 28 40 Quantity of fish
How does unemployment, unused production and economic downturns affect the PPC? • Analysis and conclusion change because we can’t assume that all available resources are fully employed • Unemployment can change the PPC curve • Show graphically by placing points inside the original production possibilities curve
PPC also shows that the true cost of any good is not just the amount of money it costs to buy, but everything else in addition to money that must be given up in order to get that good – the opportunity cost • The slope of a straight-line PPC is equal to the opportunity cost – specifically, the opportunity cost for the good measured on the horizontal axis in terms of the good measured on the vertical access
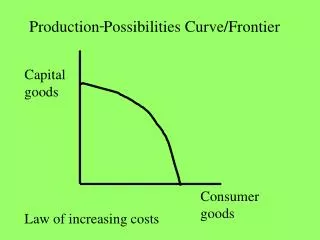
Law of increasing opportunity cost – when the production of a particular good increases, the opportunity cost of producing an additional unit rises • Increasing opportunity costs – the more fish that Tom catches, the more coconuts he has to give up to catch an additional fish • When opportunity costs are increasing rather than constant, the production possibilities frontier is a bowed-out curve rather than a straight line
Increasing Opportunity Cost Quantity of coconuts Producing the first 20 fish . . . …requires giving up 5 coconuts 35 But producing 20 more fish . . . 30 A 25 20 …requires giving up 25 more coconuts… 15 10 When more of a good is produced, its opportunity cost typically rises because well-suited inputs are used up and less adaptable inputs must be used instead 5 PPF 0 10 20 30 40 50 Quantity of fish
PPC can show economic growth • Remember, economic growth is the growing ability of the economy to produce goods and services • It literally means that the economy can produce more of everything—it is showed on a PPC as a point that lies outside the original frontier. On the PPC, growth is shown as an outward shift of the frontier
What leads to this? • Increase in the economy’s factors of production (resources used to produce goods and services) • includes land, labor, capital, entrepreneurial ability • Increase in progress in technology (technical means for the production of goods and services) • innovations in the techniques we use to produce goods and services have been a crucial force behind economic growth
Economic Growth Quantity of coconuts Economic growth results in an outward shift of the PPF because production possibilities are expanded. Production is initially at point A (20 fish and 25 coconuts), it can move to point E (25 fish and 30 coconuts). The economy can now produce more of everything. 35 E 30 A 25 20 15 10 5 Original New PPF PPF 0 10 20 25 30 40 50 Quantity of fish
Scarcity, Opportunity Costs, and the Production Possibilities Curve
Scarcity • Resources are scarce • Why do individuals have to make choices? BECAUSE RESOURCES ARE SCARCE
Scarcity • Resource is anything that can be used to produce something else • lists of the economy’s resources: • land • labor • capital • human capital (your book calls this entrepreneurial ability)
Scarcity • A resource is scarce when there’s not enough of the resource available to satisfy all the various ways a society wants to use it • Examples are natural resource, human resources (labor, skill, intelligence) and even clean air and water • One way to make choices is to allow individual choices – which is what happens in a market economy
Opportunity Costs • The real cost of an item is its opportunity cost – what you give up in order to get it • Some important decisions involve an “either-or” choice
Opportunity Costs • But other important decisions involve “how much” choices • Example: you are taking both AP Economics and AP Chemistry, you must decide how much time to spend studying for each
Opportunity Costs • “How Much” decisions is a decision to make at the margin – comparing the costs and benefits of doing a little bit more of an activity versus doing a little bit less • A decision made at the margin, involves a “trade-off” which is a comparison of costs and benefits
Explicit Costs vs. Implicit Costs • Decisions are made using the concept of opportunity cost, because the opportunity cost of an action is often considerably more than the cost of any outlays of money • Opportunity Costs can be broken into two parts: Explicit costs Implicit costs
Explicit Costs vs. Implicit Costs • Explicit Costs is a cost that requires an outlay of money • Implicit Costs, does not involve an outlay of money; instead, it is measured by the value, in dollar terms, of the benefits that are forgone • Example: • EC: an additional year of college requires tuition • IC: an additional year of college includes the income you would have earned in your have taken a job instead
Production Possibilities Curve • Used to show the trade-offs that face any economy, economists use the Production Possibilities Curve • The model is used to help understand trade-offs by considering a simplified economy that produces only two goods
The frontier – the line in the diagram – shows the maximum quantity of fish Tom can catch during a week GIVEN the quantity of coconuts he gathers, and vice versa. Quantity of coconuts D 30 A 15 B 9 C Production possibility frontier PPF 0 20 28 40 Quantity of fish
Efficiency • PPC illustrates the economic concept of efficiency • Key element of efficiency is that there are no missed opportunities in production – there is no way to produce more of one good without producing less of other goods • As long as Tom is on the PPC frontier, his production is efficient
Efficiency • An efficient in production economy is producing at a point on its production possibility frontier • Example in the economy is when people are involuntarily unemployed, they want to work but are unable to find jobs and this means the economy is not efficient in production because it could be producing more output is these people were employed
Efficiency • Efficiency also requires that the economy be efficient in allocation – allocating its resources so that consumers are as well off as possible • Efficiency for the economy as a whole requires both efficiency in production and efficiency in allocation
Efficiency Quantity of coconuts D 30 A 15 B 9 C Production possibility frontier PPF 0 20 28 40 Quantity of fish