Download
1 / 49
490 likes | 547 Vues
Learn how society's choices are depicted using production possibility curves, analyzing trade-offs, opportunity costs, and efficiency in resource allocation. Discover the impact of shifts in the curve due to technological advancements, improved economic institutions, and resource allocation. Explore concepts such as increasing marginal opportunity cost and efficient production.

E N D
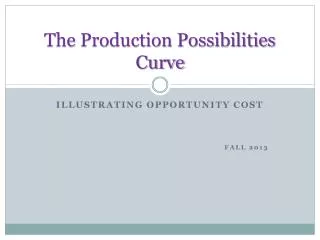
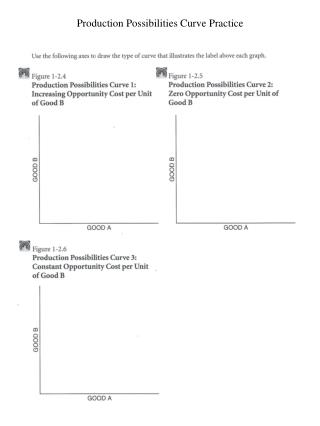
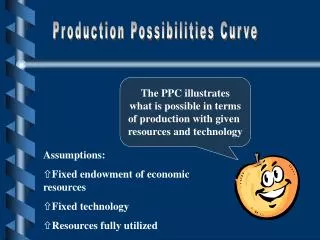
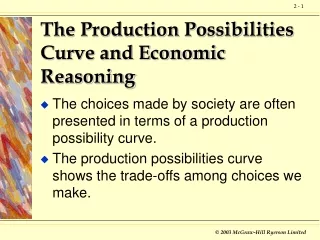
The Production Possibilities Curve and Economic Reasoning • The choices made by society are often presented in terms of a production possibility curve. • The production possibilities curve shows the trade-offs among choices we make.
The Production Possibility Table • A production possibility table lists the maximum combination of outputs that can be obtained from a given number of inputs.
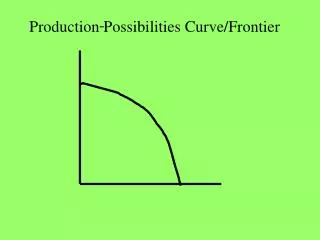
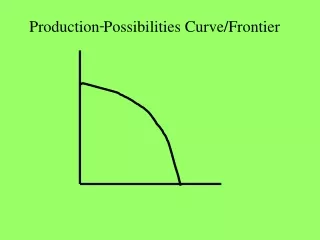
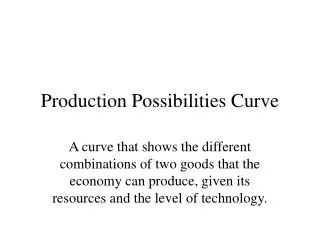
The Production Possibility Curve • A production possibility curve plots the maximum combination of outputs that can be achieved from a given number of inputs. • It slopes downward from left to right.
The Production Possibility Curve • The production possibility curve not only demonstrates the opportunity cost concept, it also measures the opportunity cost.
The Production Possibility Curve • The production possibility curve demonstrates that: • There is a limit to what you can achieve, given the existing institutions, resources, and technology. • Every choice made has an opportunity cost—you can get more of something only by giving up something else.
20 hours of economics 0 hours of history A 100 B 88 Economics grade C 70 20 hours of history 0 hours of economics D 46 E 40 58 66 78 94 98 History grade The Production Possibility Curve Fig. 2-1 (a and b), p 33 Hours of study Grade in Hours of study Grade in in history history in economics economics 20 98 0 40 19 96 1 43 18 94 2 46 17 92 3 49 16 90 4 52 15 88 5 55 14 86 6 58 13 84 7 61 12 82 8 64 11 80 9 67 10 78 10 70 9 76 1 1 73 8 74 12 76 7 72 13 79 6 70 14 82 5 68 15 85 4 66 16 88 3 64 17 91 2 62 18 94 1 60 19 97 0 58 20 100
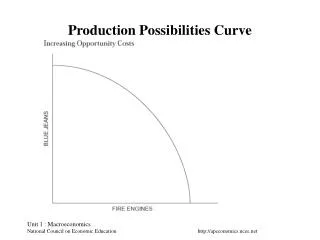
Increasing Marginal Opportunity Cost • The production possibility curve is generally bowed outward since some resources are better suited for the production of some goods.
Increasing Marginal Opportunity Cost • The concept of comparative advantage explains why opportunity costs increase as the consumption of a good increases. • Some resources are better suited for the production of some goods than to the production of other goods.
Y 10 If the slope of the production curve is -2 at A, the opportunity cost of 1X is 2Y. 9 8 A 2Y 7 . 6 5 1X 4 3 2 1 0 1 2 3 4 5 6 7 8 9 X Increasing Marginal Opportunity Cost, p 33
Increasing Marginal Opportunity Cost • The principle of increasing opportunity cost states that opportunity costs increase the more you concentrate on an activity. • In order to get more of something, one must give up ever-increasing quantities of something else.
A Production Possibility Table, Fig. 2-2a, p 34 % of resources % of resources devoted to devoted to production production Number Number of burgers of DVDs of DVDs Row of burgers 0 0 100 15 A 20 4 80 14 B 40 7 60 12 C 60 9 40 9 D 80 1 1 20 5 E 100 12 0 0 F
1 DVD 2 DVDs 5 DVDs 4 burgers 3 burgers 1 burger A Production Possibility Curve, Fig. 2-2b, p 34 A 15 B 14 C 12 D 9 DVDs E 5 F 4 7 9 11 12 Burgers 0
Slope is flat at A. Low opportunity cost of burgers. A DVDs Slope is steep at B. High opportunity cost of burgers. B Burgers Increasing Marginal Opportunity Cost, p 35
Efficiency • In our production, we would like to have productive efficiency—achieving as much output as possible from a given amount of inputs or resources.
Efficiency • Any point within the production possibility curve represents inefficiency—getting less output from inputs which, if devoted to some other activity, would produce more output.
Efficiency • Any point outside the production possibility curve represents something unattainable, given present resources and technology.
Unattainable point, given available technology, resources and labor force 10 8 C D Efficient points 6 DVDs B 4 A Inefficient point 2 0 2 4 6 8 10 Burgers Efficiency and Inefficiency, Fig. 2-3a, p 36
Shifts in the Production Possibility Curve • Society can produce more output if: • Technology is improved. • More resources are discovered. • Economic institutions get better at fulfilling our wants.
Shifts in the Production Possibility Curve • An outward shift in the production possibility curve indicates more output that can be produced with given inputs.
C D Shifts in the Production Possibility Curve, Fig. 2-3b, p 36 Neutral Technological Change DVDs A 0 B Burgers
C Shifts in the Production Possibility Curve, Fig. 2-3c, p 36 Biased Technological Change DVDs B 0 A Burgers
Distribution and Production Efficiency • The production possibilities curve focuses on productive efficiency and ignores distribution. • An increase in output that goes to one person and not to anyone else would not necessarily be efficient in some societies.
Distribution and Production Efficiency • Economists often talk about efficiency as if it means productive efficiency and achieving society's goals. • In our society, more is generally preferred to less and many policies have relatively small distributional effects.
If more inputs are available for the production of X and Y equally, the PPC shifts out along both X and Y axes. If fewer inputs are available for the production of X and Y equally, the PPC shifts in along both X and Y axes. Examples of Shifts in the Production Possibility Curve
Examples of Shifts in the Production Possibility Curve • If more inputs are available for good X only, the PPC shifts out on the X axis only. • If more inputs are available for good Y only, the PPC shifts out on the Y axis only.
Examples of Shifts in the Production Possibility CurveFig. 2-4, p 37 (b) (d) (a) (c)
Comparative Advantage, Specialization, and Trade • The production possibility curve becomes bowed out when individuals specialize in the production of goods for which they have a comparative advantage and trade with others.
Comparative Advantage, Specialization, and Trade • The comparative advantage argument used to explain the bowed-out shape of the production possibilities curve can be used to show how trade makes society better off.
Comparative Advantage, Specialization, and Trade • Collaboration and specialization can make society better off. • Total production can rise.
Comparative Advantage, Specialization, and Trade • The outward bow graphically represents the potential gains from trade.
The Gains From Trade • Sunder can either write one economics paper or four creative writing papers in a day. • Ti can either write one creative writing paper or four economics papers in a day.
The Gains From Trade • Sunder has a comparative advantage in creating writing and Ti has a comparative advantage in economics.
The Gains From Trade • The following table and production possibility curves demonstrate how output increases when two individuals collaborate and specialize in the activity for which each has a comparative advantage.
The Gains From Trade • Each individual's PPC is drawn by connecting the number of papers each can write in a day on a graph.
The Gains From Trade,Fig. 2-6c, p 41 5 4 Economics 3 2 (a) Ti (b) Sunder 1 1 2 3 4 5 Creative writing
The Gains From Trade • The combined PPC curve is drawn by finding three points and connecting them.
The Gains From Trade, Fig. 2-6c, p 41 A (c) Combined with trade 5 B 4 Economics 3 2 (a) Ti (b) Sunder 1 C 1 2 3 4 5 Creative writing
The Gains From Trade • Point A: This is the combined number of economics papers they both can write in a day. • If economics papers are on the Y axis, it is point 0,5.
The Gains From Trade • Point B: This is the combined number of creative papers they both can write in a day. • If economics papers are on the Y axis, it is point 5,0.
The Gains From Trade • Point C: This is where each is focusing on that activity for which he or she has a comparative advantage. • Sunder writes four creative papers and Ti writes four economics papers. • This is the coordinates 4,4.
The Gains From Trade • The combined PPC is bowed out because of comparative advantage and specialization.
The Division of Labor • Markets allow specialization and the division of labor. • They allow individuals to develop their comparative advantages, thereby increasing the production possibilities of society.
Markets, Specialization, and Growth • Markets and specialization have led to growth.
Markets, Specialization, and Growth • The growth in per capita income (constant 1990 dollars) in the past 2 millennia has been astonishing. • This owes largely to the introduction of markets and democracy.
Markets, Specialization, and Growth • As people are allowed to compete and specialize, they get better at what they do, develop new technologies and the market grows ever larger.
col17930_0207.eps $6,000 $5,000 $4,000 Per capita income (in 1990 international dollars) $3,000 $2,000 $1,000 0 500 1000 1500 2000 Growth in the Past Two Millennia Fig. 2-7, p 42
The Economic Organization Of Society End of Chapter 2

![Production Possibilities Curve [ better known as the “PPC”]](https://cdn1.slideserve.com/2233211/slide1-dt.jpg)