Download

1 / 50
550 likes | 931 Vues
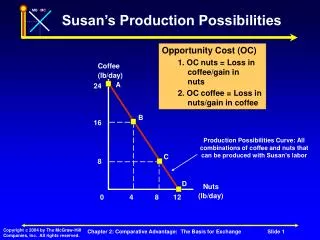
Production Possibilities Curve [ better known as the “PPC”]. TINSTAAFL. There Is No Such thing As A Free Lunch. Everything has a cost. This cost [opportunity cost] is one of the most important concepts of the PPC. Chick Fil A.

E N D
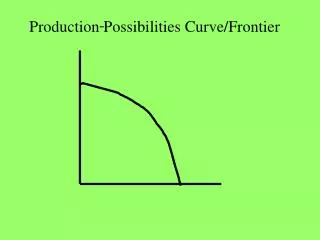
Production Possibilities Curve [ better known as the “PPC”]
TINSTAAFL There Is No Such thing As A Free Lunch. Everything has a cost. This cost [opportunity cost] is one of the most important concepts of the PPC. Chick Fil A Gained food, gave up gas money, Opportunity Cost was gas money... I guess you are riding with a friend, while eating your sandwich!! 100 Gained gas, gave up food, so opportunity cost was #1 combo at Chick Fil A. Hungry, but cruzin’! 50 Gas Money 20 40
TINSTAAFL This cost [opportunity cost] is one of the most important concepts of the PPC. At this point something went great… you found $10!! Or a coupon, or gas prices dropped, but you have more than you thought! To get to this point, a point of INNEFFICIENCY something is wrong. You lost you $10… no gas… no food. Maybe you lost only $5… only a gallon of gas, or some fries… Chick Fil A 100 50 Gas Money 20 40
Get out another sheet of notebook paper… Get ready to draw:
Production Possibilities Curve [PPC] Let’s look at the difference between constant and increasing [opportunity] cost. Whole Pizza’s Hamburger $1.00 e Hamburger Chicken Sandwich $1.00 e Increasing [opportunity] Cost Constant [opportunity] Cost
Budget Line Number of hamburgers & pizzas that can be bought for $30.
Limits of Production Straight-Line Production-Possibility Frontier Constant Opportunity Cost 1 Bus=4 Cars; ¼ Bus=1 Car A 10 9 C D 8 Number of Buses [ millions] 7 6 5 E 4 3 2 1 B 0 2 4 6 8 10 12 14 1618 20 22 2426 2830 3234 36 38 40 Number of cars [Millions]
Limits of Production Constant Opportunity Cost 1 T-shirt = 2 movies; ½ T-shirt = 1 movie Movies 6 5 4 3 2 1 Opportunity Cost Opportunity Benefit 0 1 2 3 T-shirts
PPC If we are inside the PPC, does anything have to be given up? So – the answer is … The 4 assumptionsof the PPC [the “curve” are these. FixedResources Full Employment 38 FixedTechnology TwoProducts A B F Unattainable [More/better Resources, Technology] C *Shows opportunity cost more than anything Robots E Inefficient [Under or unemployment] This PPC Linemeans we are operating at full capacity with best available resources/ technology & producing at its full potential. D Boom Boxes
A F 120 110 100 90 80 70 60 50 40 30 20 10 iPod Shuffle [1GB-240 songs] Classical Songs You could now even download a little Rap. Beethoven B iPod Shuffle [512MB-120 songs] E C Gained 30 Pop songs; lost 30 Classical songs D Suzie Rah Rah 0 10 20 30 40 50 60 70 80 90 100 110 120 Pop Songs Suppose that Suzie Rah Rah buys an iPod Shuffle [512MB] with a maximum capacity of 120 songs and loads up 60 Classical songs and 60 Pop songs. If she had put 120 classical songs on her iPod,then there be no room for Pop songs without giving up some classical like Yo-Yo Ma. Notice that at point E, Suzie can add more music of either w/o incurring opportunity cost. Say Suzie is currently at point B and moves to point C. If Suzie moves from point C back to point B, she would gain 30 classical songs and lose 30 Pop songs. What needs to happen for Suzie to be able to move beyond PPF curve ABCD [Let’s say point B to point F? If Suzie is using the maximum capacity of the smaller iPod Shuffle [512MB with120 songs],what is the opportunity cost of classical songs she must giveup to get one more Pop song? She would be gaining 30 Pop songs but losing 30 classical songs. If Suzie bought an iPod with greater storage space, like the iPod Shuffle [1GB - 240 songs]. Constant opportunity cost of “1” Classical song for each Pop song.
The STRAIGHT LINE shows the two products Are “equallysubstitutable”, that is, they are not specialized inparticular uses, so the opportunity costs will remain constant. Constant Opportunity Cost 1 Corn = 1 Tomato
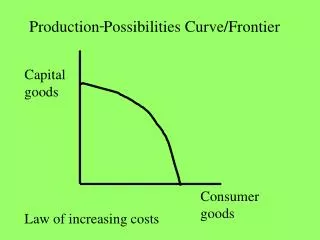
Economic resources are not completely adaptable to alternative uses. The “curve” indicates a “changing trade-off.” Obtaining more of one good requires giving up larger amounts of the alternative good. “Less now” but “more later” A B Possibilities-A, B, C, D, & E Impossibility [more/better resources, better technology] C Less than Possibilities – H & G [Idle Resources-inefficient] D Most PPF lines are bowed outward. Robots [Thousands] These alternatives are unrealistic extremes as an economy typically produces both capital and consumer goods. “more now” at the expense of “much more later” E Pizza[hundreds of thousands]
Demonstrating "Economic Growth" on a PPC Graph - ability to produce a larger total output over time. Economic Growth d a e b Capital Goods [Robots] f C 0 Consumer Goods [Pizza]
The straight line shows the two products are “equally substitutable”, that is they are not specialized in particular uses, so the opportunity costs will remain the same. Increasing Cost Constant Cost Decreasing Cost
A convex curve (bowed-in) shows the Law of Decreasing Cost – for each additional bread – decreasing amounts of robots are given up. Let’s demonstrate “decreasing opportunity cost”
Economic Growth • More/better resources • Better technology A’ 14 13 12 11 10 9 8 7 6 5 4 3 2 1 Production Possibilities Curve B’ A B C’ Unattainable C Industrial Robots D’ D Now Attainable Attainable E’ E 0 1 2 3 4 5 6 7 8 9 Pizzas
Four Assumptions for our PPC Model 1. Resources are fixed. There is no way to increasethe availabilityof land, labor, capitalor entrepreneurship. However, reallocation of these resources is possible. 2. All resources are fully employed. No unused land, labor, capital, or entrepreneurship exists. The economy is running at full production and producing goods and services at the least cost (productive efficiency]. 3. Technology is fixed. No new technological breakthroughs. PPC represents one specific time period. 4. Only two things can be produced[2-good model] “There is no free pizza.” [We are freezing the economy in time to focus on the economy’s productive alternatives based on research and technology of today.]
Five PPC Concepts . • 1. Scarcityis represented by the frontier line. • 2.Choices-represented by pts A, B. or C. • [Choices implies “opportunity cost”] 3. Opportunity Costis illustrated in terms of moving from one point to another on the PPC, when resources are being utilized to their full potential. [must make choices] 4. Efficiency- producing maximum output with available resources and technology. We can’t increase production of one good without decreasing that of another. 5. Economic growthoccurs for one of two reasons. A. More resources[land, labor, or capital] become available. B. Technology improves. [more outputs from same inputs]
Production Possibilities in table form PIZZA 0 1 2 3 4 (in hundred thousands) Robots 10 9 7 4 0 (in thousands) graphical form Robots (thousands) Pizzas(hundred thousands)
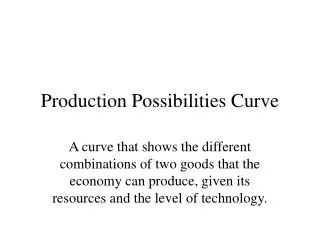
Production Possibilities Limited Resources means a limited output... At any one point in time, a full-employment, full-production economy must sacrifice some of product to obtain more of product . Or, sacrifice some of product to obtain more of product .
Production Possibilities Q 14 13 12 11 10 9 8 7 6 5 4 3 2 1 Unattainable A B W C Attainable & Efficient Robots(thousands) D Attainable but Inefficient E 1 2 3 4 5 6 7 8 Pizzas(hundred thousands) Q
Q 14 13 12 11 10 9 8 7 6 5 4 3 2 1 Robots(thousands) Q 1 2 3 4 5 6 7 8 Pizzas(hundred thousands) Production Possibilities Unemployment & Underemployment Shown by PointU More of either or both is possible U
Q 14 13 12 11 10 9 8 7 6 5 4 3 2 1 Economic Growth Robots(thousands) Q 1 2 3 4 5 6 7 8 Pizzas(hundred thousands) Production Possibilities The ability to produce a larger total output - a rightward shift of the production possibilities curve caused by...
Q 14 13 12 11 10 9 8 7 6 5 4 3 2 1 Economic Growth Robots(thousands) Q Production Possibilities More of either or both is possible. 1. Increase in resources - 2. Better resource quality - 3. Technological advances - 1 2 3 4 5 6 7 8 Pizzas(hundred thousands)
Production Possibilities Two Examples of Economic Growth FAVORING PRESENT GOODS CURRENT CURVE Goods for the Future CONSUMPTION Goods for the Present
Production Possibilities Two Examples of Economic Growth FAVORING FUTURE GOODS FAVORING PRESENT GOODS CONSUMPTION CURRENT CURVE FUTURE CURVE FUTURE CURVE Goods for the Future Goods for the Future CURRENT CURVE CONSUMPTION Goods for the Present Goods for the Present
Production Possibilities More or better resources or better technology A E B PPC Capital Goods D C Consumption Goods 41. At what letter is there unemployment [recession]? 42. What letters represent resources being used in their most productive manner? [full employment, full production, and best available technology] 43. What letter represents an improvement in technology, therefore a new PPC frontier line? 44. The (straight line/curve) illustrates the “line ofincreasing cost”? 45. The (straight line/curve) illustrates the “law of constant cost.” 46. At what letter would there be the most economic growth in thefuture if a country were producing there now? What is the opportunity cost when moving from“C” to “A”; Bto C; & do we have to give anything up when moving fromD to B? D A, B, or C E A Consumption Capital no
A H G PPC AP Questions 1. An economy that is fully employing all its productive resources but allocating less to investmentthan toconsumption will be at which of the following positions on the PPC to the right? a. A b. B c. C d. D e. E 2. Which of the following best explains the shape of the PPC for the two-commodity economy shown above? a. Opportunity cost of producing another unit of each stays the same. b. Opportunity cost of producing another unit of each decreases. c. Opportunity cost of producing another unit of each increases. 3. Which of the following is true of the PPC on the right? a. Point Q is attainable but undesirable. b. Point R is unattainable but undesirable. c. A technological improvement of watches would move the economy from T to P. d. There is unemployment at point T because workers e. The opportunity cost of moving from S to T is the # of watches given up. 4. If we move from B to C on the graph (right), the opportunity cost is? a. AH units of good Y b. OG units of good Y c. EF units of good X d. HG units of good Y B C
PPC AP Questions 5. Which of the following would cause the PPC shown (right) to shift outward? a. Reopening steel plants that had been closed b. Rehiring laid-off workers c. Using machinery for missile production instead of steel production d. Using machinery for steel production instead of missile production e. Developing a more efficient steelmaking process 6. Base on the graph (right), which statements are true? I. The opportunity cost of moving from P to R is 10 units of Y. II. The opportunity cost of moving from R to P is 8 units of X. III. The opportunity cost of moving from Q to R is 0 units. a. I only b. III only c. I & II only d. I, II, & III Missiles Steel Y X
From the 2005 Macro MC Exam (89%) 3. If two coats are currently being produced, the opportunity cost of producing the third coat is a. 85 belts b. 75 belts c. 40 belts d. 15 belts e. 10 belts 100 95 85 Belts 70 PPC 40 0 1 2 3 4 Coats
The Circular Flow The Circular Flowis an abstract, oversimplified model, showing how economic transactions [resources, products (g/s), and money] take place. iFuzzy iWuzzy Products [goods/services] 1 2 a. Goods and services[iFuzzy] b. Consumer expenditures c.Land, labor, cap., entrepreneur d. Rent, wages, interest, & profits 1 2 Householders Businesses 4 3 3 Resources [Land, labor, cap., ent.] 4
The Circular Flow D S D S [iFuzzy iWuzzy] Resource Market Product Market 1 Resources [Land, labor, cap., ent.] 2 a. Goods and services[iFuzzy] b. Consumer expenditures c.Land, labor, cap., entrepreneur d. Rent, wages, interest, & profits 3 4 Householders Businesses 2 1 [iFuzzy iWuzzy] 3 Products [goods/services] 4
Hog CIRCULAR FLOW MODEL RESOURCE MARKET 1 2 Mechanic • Products [Goods/services] • Consumer expenditures • Land, Labor, Capital, Entrepreneur • Rent, Wages, Interest Profits 4 HOUSEHOLDS BUSINESSES 3 3 PRODUCT MARKET 4
Hog CIRCULAR FLOW MODEL RESOURCE MARKET 1 2 Mechanic • Products [Goods/services] • Consumer expenditures • Land, Labor, Capital, Entrepreneur • Rent, Wages, Interest Profits 4 HOUSEHOLDS BUSINESSES 3 1 2 3 4 PRODUCT MARKET
CIRCULAR FLOW MODEL $ COSTS $ INCOMES RESOURCE MARKET RESOURCES INPUTS BUSINESSES HOUSEHOLDS GOODS & SERVICES GOODS & SERVICES PRODUCT MARKET $ REVENUE $ CONSUMPTION
The Circular-Flow Diagram Product Market 1 2 What flow are the following? A. Consumer expenditures? B. Goods and services? C. Land, labor, capital, and entrepreneurs? D. Rent, wages, interest, and profits? 2 1 4 3 Businesses Households Labor 3 4 Resource Market
The Circular-Flow Diagram Resource Market Labor 1 2 • What flow are the following? • A. Goods/services[iOuthouse] • B. Consumer expenditures? • C. Land, labor, capital and • entrepreneurial ability? • Rent, wages, interest, • and profits? 4 3 1 2 Households Businesses iOuthouse 5GS 3 4 Product Market
GOVERNMENT GOODS & SERVICES FLOW TO BUSINESSES NET TAXES FLOW TO GOVERNMENT FROM BUSINESSES GOVERNMENT’S ROLE in a Mixed Economy $ COSTS $ INCOMES RESOURCE MARKET RESOURCES INPUTS G/S HOUSEHOLDS BUSINESSES Taxes GOVERNMENT GOODS & SERVICES GOODS & SERVICES PRODUCT MARKET $ REVENUE $ CONSUMPTION
GOODS & SERVICES FLOW TO HOUSEHOLDS FROM GOVERNMENT NET TAXES FLOW TO GOVERNMENT FROM HOUSEHOLDS GOVERNMENT’S ROLE in a Mixed Economy $ COSTS $ INCOMES RESOURCE MARKET RESOURCES INPUTS G/S National Defense BUSINESSES HOUSEHOLDS Taxes GOVERNMENT GOODS & SERVICES GOODS & SERVICES PRODUCT MARKET $ REVENUE $ CONSUMPTION
EXPENDITURES FLOW TO ACQUIRE RESOURCES RESOURCES FLOW TO GOVERNMENT GOVERNMENT’S ROLE in a Mixed Economy $ COSTS $ INCOMES RESOURCE MARKET INPUTS RESOURCES L,L,C,E BUSINESSES HOUSEHOLDS GOVERNMENT GOODS & SERVICES GOODS & SERVICES PRODUCT MARKET $ REVENUE $ CONSUMPTION
GOVERNMENT EXPENDITURES FLOW TO PRODUCT MARKET GOODS & SERVICES FLOW TO GOVERNMENT GOVERNMENT’S ROLE in a Mixed Economy $ COSTS $ INCOMES RESOURCE MARKET RESOURCES INPUTS GOVERNMENT BUSINESSES HOUSEHOLDS B-2 Bombers GOODS & SERVICES GOODS & SERVICES PRODUCT MARKET $ REVENUE $ CONSUMPTION
Practice iFuzzyiWuzzy Circular Flow 1. In the product market (householders/businesses) are the demanders and (householders/businesses) are the suppliers. 2. In the resource market (householders/businesses) are the demandersand (householders/businesses) are the suppliers. 3. In the resource market, (householders/businesses) sell resources to (householders/businesses). 4. In the product market, (householders/businesses) sell products [goods/services] to (householders/businesses).
Note Sheet Questions 47-50 Resource Market 1 2 Labor Which Flow Represents? 47. Consumer expenditures? 48. Good/Svc [iFuzzy being sold] 49. Land, labor, capital and entrepreneurial ability? 50. Rent, wages, interest, and profits? 4 3 2 1 Businesses Households iFuzzyiWuzzy 3 4 Product Market
Review forBasic Concepts “You da man”
Circular Flow The “GangstaCar” Product Market Chrysler300 “Gangsta Car 1 2 Which flow represents? A. Consumer expenditures? B. Goods and services? C. Land, labor, capital, and entrepreneurial ability? D. Rent, wages, interest, and profits? 2 1 4 ChryslerPlant Businesses 3 Households Laborfor “Gangsta Cars” 3 4 Resource Market
The Circular-Flow Diagram Resource Market Labor 1 2 Which Flow Represents? A. Goods/services? B. Consumer expenditures? C. Land, labor, capital and entrepreneurial ability? D. Rent, wages, interest, and profits? 4 3 1 2 Households Businesses Fuzzy Wuzzy 3 4 Product Market
Production Possibilities A More or better resources or better technology E B Capital Goods D C Consumption Goods 41. At what letter is thereunemployment [recession]? 42. What letters represent resources being used in their most productive manner? [full employment, full production, and best available technology] 43. What letter represents animprovement in technology, therefore anew PPCfrontier line? 44. The (straight line/curve) illustrates the“law of increasing cost”? 45. The (straight line/curve) illustrates the“law of constant cost.” 46. At what letter would there be themost economic growth inthe future if a country wereproducing there now? What is theopportunity costwhen moving from“C”to“A”; when moving from B to C; anddo we have to give anything upwhenmoving fromD to B? D A, B, orC E A Consumption Capital no