Production Possibility curve
270 likes | 843 Vues
Production Possibility curve. Warm-Up 10/14. In your notebook answer the following: What is scarcity? Give me an example of scarcity. What are the 4 Factors of Production? Give an example of each. Production Possibilities curve. Vocabulary

Production Possibility curve
E N D
Presentation Transcript
Warm-Up 10/14 In your notebook answer the following: What is scarcity? Give me an example of scarcity. What are the 4 Factors of Production? Give an example of each.
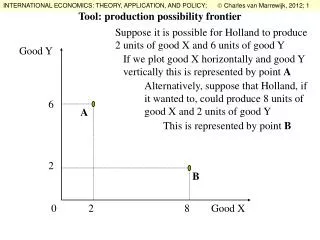
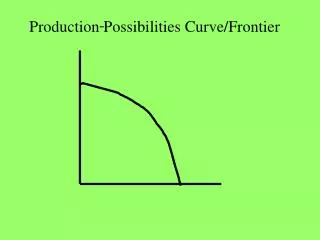
Production Possibilities curve Vocabulary • Economic Model: simplified representation of economic forces. • Production Possibilities Curve (PPC): graph used by economists to show the impact of scarcity on an economy.
Objectives • Be able to describe what a production possibility curve is and how it is constructed. • Be able to explain what economists learn from using production possibility curves. • Be able to analyze how production possibilities curves show economic growth.
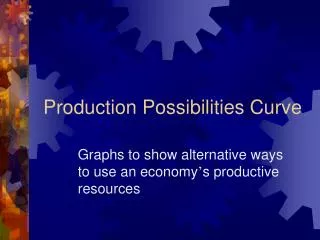
Graphing the possibilities • All economic choices involve trade-offs • Economists have created economic models to clarify trade-offs • Example: Production possibilities curve
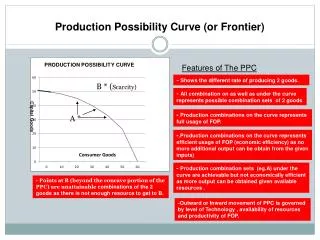
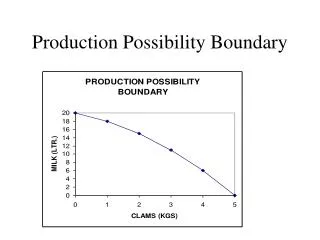
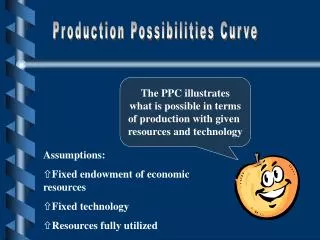
PPC • A graph used to show the impact of scarcity on an economy by showing the maximum number of goods or services that can be produced using limited resources.
PPC Assumptions • Based on assumptions that simplify the economic interactions: • Resources are fixed • All resources are fully employed • Only two things can be produced • Technology is fixed
How is the PPC used? • The curve on a PPC represents the border between what is possible to produce and what is not possible to produce. • Useful for businesses, governments, and individuals
Example • Suppose you are preparing food for a soup kitchen and have the ingredients to make 12 loaves of bread or 100 bran muffins or some combination of the two. • A PPC can help you decide what to make. • (Interactive model)
What we learn from Ppcs • No economy actually operates according to the simplified assumptions underlying the PPC. • Economists use it because it spotlights concepts that work in the real world of scarce resources. • One important concept that is revealed is PPC efficiency.
New Vocabulary • Efficiency: involves producing the maximum amount of goods and services possible. • Underutilization: means producing fewer goods and services than possible
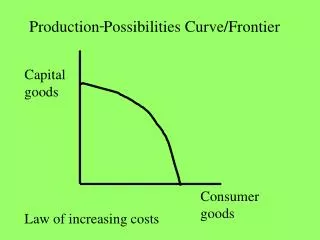
Efficiency & underutilization • “Guns” vs. “Butter” • Guns is shorthand for military spending • Butter is shorthand for consumer products
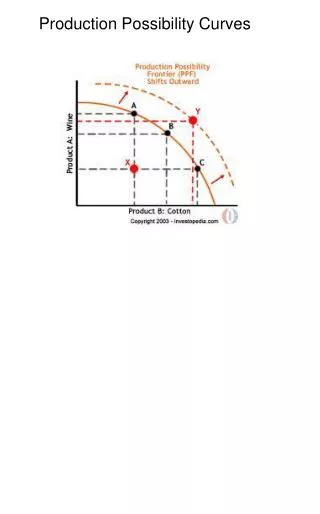
Guns vs. butter • Regardless of the combination, each point represents efficiency, the most that can be produced with the available resources. • Any point inside the curve represents underutilization, or the inefficient use of available resources.
Shape of the ppc • The shape of the PPC shows a 3rd important economic concept – the law of increasing opportunity costs • As production switches from one product to another, increasingly more resources are needed to increase the production of the second product