Understanding Holland's Production Possibility Frontier for Goods X and Y
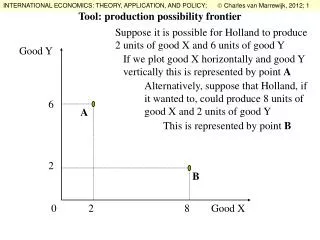
This overview explains Holland's production possibilities for goods X and Y, illustrating two efficient production combinations represented by points A (2 units of X and 6 units of Y) and B (8 units of X and 2 units of Y). By plotting these on a graph, we can visualize the production possibility frontier (PPF), which connects all efficient production combinations. The space within the curve represents all possible output combinations, while portions outside demonstrate inefficiency. Understanding the PPF helps assess resource allocation and productivity.

Understanding Holland's Production Possibility Frontier for Goods X and Y
E N D
Presentation Transcript
Good Y 6 A 2 B 0 2 8 Good X Tool: production possibility frontier Suppose it is possible for Holland to produce 2 units of good X and 6 units of good Y If we plot good X horizontally and good Y vertically this is represented by point A Alternatively, suppose that Holland, if it wanted to, could produce 8 units of good X and 2 units of good Y This is represented by point B
Good Y B 0 Good X Tool: production possibility frontier Perhaps, Holland cannot only produce combinations A and B but many other different combinations also Here we have drawn a few We call the line connecting all possible different combinations the production possibility curve (or prod. pos. frontier; ppf) A
Note that the production possibility curve only connects Point C (2 X and 2 Y) can be produced by Holland, but it could produce more of Y (at A) or more of X (at B) or more of both goods (the red line between A and B) C Tool: production possibility frontier Good Y efficient production combinations. A B 0 6 Good X
Thus, the production possibility curve represents efficient Good Y output combinations. All possible combinations of final output (including non-optimal combinations) is called the production possibility set 0 Good X Tool: production possibility frontier