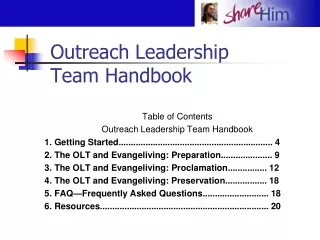
Performance Improvement Team Handbook
Performance Improvement Team Handbook. Developed by Southeast Georgia Health System Quality Management Department. Introduction.

Performance Improvement Team Handbook
E N D
Presentation Transcript
Performance Improvement Team Handbook Developed by Southeast Georgia Health System Quality Management Department
Introduction Congratulations! You all have been selected as members in a new PI team. The most critical task for any new team is to establish its purpose, process and measures of team progress. Once these are established, they should be posted at each team meeting for reference. Many teams enjoy terrific starts and then soon fizzle. The real challenge is to keep a team focused on its purpose. We use the PDCA model for PI teams and we are introducing the Rapid Performance Improvement (RPI) Methodology. Teams make improvements related to the six aims: safe, effective, patient centered, timely, efficient and equitable. As a result clinicians experience greater satisfaction at being able to better do their jobs and bring improved health to those who receive their care.
Teams Utilize the PDCA Methodology • P: Plan the improvement • D: Do the data collection needed, implement the modified or new process • C: Check the data for improvement • A: Act to sustain the improvement
The PDCA cycle for learning and improvement Act Plan Objective Questions and predictions (why) Plan to carry out the cycle (who, what, where, when) What changes are to be made? Next cycle? Check Do • Complete the • analysis of the data • Compare data to • predictions • Summarize what • was learned Carry out the plan Document problems and unexpected observations Begin analysis of the data
Principles of PDCA Cycles • Use shorter cycles of changes to accelerate rate of improvement • small scale tests (“What can you test by next Tuesday”) • just collect enough information • Create flow of ideas, then emphasize implementation • increase the frequency of tests • increase the belief that the change will result in improvement and minimize resistance upon implementation • Adoption of existing knowledge (‘not more research but more application of existing knowledge’) • ‘Steal shamelessly, Share senselessly’ • Promote peer learning
Tips for PDCA Cycles - formulate question and predict results - test first in ‘safe zones’ (with team members, volunteers) - ‘Just-do-it’ mentality • collect useful just enough data, not perfect data • think a couple of cycles ahead • scale down size of test (# of patients, clinics) • be innovative to make test feasible
Smaller Scale Tests: Scale Down Timeframe • Years • Quarters • Months • Weeks • Days • Hours • Minutes Reduce your timeframe to plan Test Cycle!
New Teams may utilize the Rapid Performance Improvement (RPI) Methodology • Rapid Performance Improvement (RPI) Methodology, a practical performance-based process improvement approach. The sequence of steps involved is: • Document the goals and problems to be addressed • Current performance is documented • Practices are compared to best practice and “gaps” are identified • Gaps are prioritized and a revised process is developed to achieve these objectives • The revised processes are deployed to the target groups and results are monitored • Performance and process adherence are assessed to determine the level of success. The resulting new practices become the target groups’ current performance and the cycle is repeated.
Rapid Performance Improvement (RPI) Methodology Tools Gap Analysis: Gap Prioritization:
Team Roles All members except the facilitator are active team members even though they may have additional roles.
Team Roles • Team Member • Members are chosen because they work in, have knowledge of that is the focus of the team. or receive benefit of the process that is the focus of the team. They share responsibility for the effectiveness of the team. • Contribute ideas • Make decisions • Plan future work • Support collaboration • Collect and analyze data • Team Leader • The leader is generally the person who is recognized as the owner of the process that is the focus of the team. • Works with the facilitator to develop a plan for the team • Coordinates and directs the work of the team • Manages the meeting process • Recorder • Recorder can be assigned or rotated to help the team maintain a record of its work. • Records on flipchart when needed • Takes minutes • Timekeeper • Timekeeper can be assigned or rotated to help the team manage time. • Helps the team determine how it wants to be informed about the time • Calls out the time remaining on agenda items or at designated intervals decided by the team. • Facilitator • Facilitator is a team advisor who monitors and helps team members keep their interactions positive and productive. • Works with the team in developing plans • Provides feedback to the team to keep them on track • Assists in interpretation of data • Assists in maintaining efficiency
Team Rules • Keep an open mind • Listen and understand what is said • Avoid side conversations • Respect other’s opinions • Avoid personal agendas • Come prepared to do what’s good for the health system • Complete assignments • Follow up on action items • No idea is a bad idea • Be creative • Take risks • No criticism allowed • Start on time • End on time • Participate! • Have fun!
Brainstorming Activity • Generate ideas • Use games and exercises to “warm up” your creative thinking • When ideas slow down, try another exercise to generate fresh ideas • Breaking into smaller groups may be helpful • Use a computer or flip chart to capture every comment/idea
Set SMART Goals • Goals are • Specific • Measurable • Achievable • Realistic • Time-phased • Set goals: realistic, reasonable, challenging, attainable goals • Long-term • Intermediate-term • Short-term
Using Data • Identify why we are collecting the data • JCAHO PI.1.1, DHR, CMS • What are we going to do with it? • Always define data • Ask yourself if the data is complete or do we need additional information • When using data, define targets and benchmarks. Identify those benchmarks on the graphic displays. • Remember: Data is not information until it has been interpreted!
Statistical Terms • Mean-sum of quantities/number of quantities (the average) • Median-middle value when all data points are arranged numerically; used a lot of times as the middle line in run charts because it requires no calculation • Mode-the most frequently occurring value • Standard deviation-measure of the spread of a distribution • Control limit-an expected limit of common-cause variation referred to as either an upper or lower limit. Limits are calculated from process data • Variation-the inevitable difference among individual outputs of a process. The sources of variation can be grouped into two major classes: Common Causes and Special Causes.
Performance Improvement Tools • Flowcharts are available in Powerpoint and QI Macros in Excel. • Oval represents the beginning or ending of a process • Rectangle represents an action step in the process. • Diamond represents a decision step. • Arrows represent the direction of the process flow.
Performance Improvement Tools • Tree Diagram • Run Chart • Histogram • Pareto Chart Tools are available in QI Macros in Excel
Performance Improvement Tools • Failure Modes and Effects Analysis • Scatter Diagram and Probability Plot • Comparison Matrix • Relationship Diagram Tools are available in QI Macros in Excel
Plans of Action • Develop programs/methods/plans of action: • The requirements for achieving set goals. • Who will do which part. • How the different parts tie together. • Determine the phases of the action plan • Identify a representative that will be responsible for each phase. • Determine the beginning, middle, and end of each phase. • Determine benchmarks to measure strengths and areas of improvement
References • Moen, Ronald, Thomas Nolan; “Process Improvement” Quality Progress, 1987, p62 • Langley, Gerald, Kevin Nolan and Thomas Nolan; “The Foundation of Improvement,” Quality Progress, June 1994, p. 81 • Langley, Gerald, Kevin Nolan, Thomas Nolan, Cliff Norman, and Lloyd Provost; “The Improvement Guide” San Francisco, CA; Jossey-Bass, 1996 • Nolan, Kevin; “ASQs Accelerating Change Collaborative Series: A Challenge for Industry,” Quality Progress, Jan 1999, p55 • 2006 Hospital Accreditation Standards. Joint Comission on Accreditation of Healthcare Organizations. 2006. • QI Macros Training Manual. Lifestar. 2005.