Download
1 / 11
130 likes | 300 Vues
This article explores the concept of learning curves and their impact on performance improvement in manufacturing. As individuals and organizations gain experience in tasks, they see a reduction in the time required to produce units. The theory explains that as the cumulative number of produced units doubles, production time decreases at a consistent rate. Key aspects include cognitive versus manual learning, learning curve equations, and their implications for productivity and efficiency. Understanding these factors can lead to significant cost savings and performance optimization.

E N D
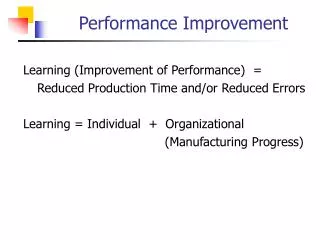
Performance Improvement • Learning (Improvement of Performance) = • Reduced Production Time and/or Reduced Errors • Learning = Individual + Organizational • (Manufacturing Progress)
Learning Curves • Theory • As people gain experience performing a task, • the time it takes to complete the task decreases. • Specifically, • as the accumulated number of units doubles, • the time required to produce a unit declines • at a constant rate. • Note: Cognitive Learning > Manual Learning
Learning Curve Equations • Hyperbolic Yx = KXN • Logarithmic log Yx = log K + N log X • Yx = Cumulative Average Time to Produce X Units • K = Time Required to Produce the First Unit • X = Cumulative Total Number of Units Produced • N = Exponent of the Learning Curve Slope (tan q)
Synonyms • Learning Curve • Manufacturing Progress Function • Cost / Quantity Relationship • Product Acceleration Curve • Improvement Curve • Performance Curve • Experience Curve • Efficiency Curve
Learning Curve • Slope LC % • - 0.514 70 • - 0.415 75 Assembling • - 0.322 80 • - 0.234 85 Welding • - 0.152 90 • - 0.074 95 Machining
Notes • LC % = 2N where N = tan q • New Production Time (Cost) = LC % x Old • As total number of production units increases and/ • or average production time per unit decreases, • q (tan q) decreases which implies LC % increases. • Shallow learning curves (higher LC %) means • relatively limited cost savings.
Learning Curve Solutions Click for Solutions Generator
Food for Thought • Was it Agatha Christie’s Inspector Poirot or maybe • Dr. Watson’s comment to Sherlock Holmes • “we often go more quickly by going more slowly”. • Maxim for Computer-Aided Statistical Analysis • Garbage In = Gospel Out