Chapter 7: Costs and Cost Minimization
600 likes | 1.49k Vues
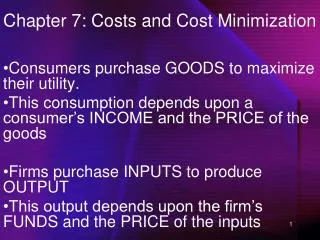
Chapter 7: Costs and Cost Minimization. Consumers purchase GOODS to maximize their utility. This consumption depends upon a consumer’s INCOME and the PRICE of the goods Firms purchase INPUTS to produce OUTPUT This output depends upon the firm’s FUNDS and the PRICE of the inputs.

Chapter 7: Costs and Cost Minimization
E N D
Presentation Transcript
Chapter 7: Costs and Cost Minimization • Consumers purchase GOODS to maximize their utility. • This consumption depends upon a consumer’s INCOME and the PRICE of the goods • Firms purchase INPUTS to produce OUTPUT • This output depends upon the firm’s FUNDS and the PRICE of the inputs
Chapter 7: Costs and Cost Minimization In this chapter we will cover: 7.1 Different Types of Cost 7.1.1Explicit and Implicit Costs 7.1.2 Opportunity Costs 7.1.3 Economic and Accounting Costs 7.2 Isocost Lines 7.3 Cost Minimization 7.4 Short-Run Cost Minimization
7.1.1 Implicit and Explicit Costs Explicit Costs: Costs that involve an exchange of money -ie: Rent, Wages, Licence, Materials Implicit Costs: Costs that don’t involve an exchange of money -ie: Wage that could have been earned working elsewhere; profitability of a goat if used mowing lawns instead of for meat
7.1.2 Opportunity Costs • Definition: Value of the next best alternative; total benefit of choosing the next best option • IE: Instead of opening his own Bait shop, which cost $5,000 per month to run (explicit cost), Buck could have worked for Worms R Us for $2,000 per month (implicit cost). • His opportunity cost is $2,000 (alternate wage) + $5,000 (the amount he WOULDN’T have to pay each month) = $7,000
7.1.3 Economic and Accounting Costs • Economists & Accountants calculate costs differently: • Economists are interested in studying how firms make production & pricing decisions. They include all costs. • Economic Costs = Explicit + Implicit Costs Accounting Costs • Accountants are responsible for keeping track of the money that flows into and out of firms. They focus on explicit costs. • Accounting Costs = Explicit Costs
Economic Profit Accounting Profit Implicit Costs Revenue Revenue Economic Costs Explicit Costs Explicit Costs Profit: Economists vs Accountants Economist’s View Accountant’s View
Defining Sunk Cost Sunk Costs are costs that must be incurred no matter what the decision. These costs are not part of opportunity costs. Example: Giant Dancing Elasticity sign • It costs $5M to build and has no alternative uses • $5M is not a sunk cost for the decision of whether or not to build the sign • $5M is a sunk cost for the decision of whether to operate or shut down the sign
Costs Example Last year, Hugo decided to open a box factory. Hugo built the factory for $200,000. Materials and wages required to make a box amount to 5 cents per box. Before starting production, Hugo was offered a job at BoxMart that paid $4,000 a month. Classify Hugo’s costs (explicit, implicit, economic, accounting, and sunk)
Costs Example Explicit Costs: Factory ($200K – historic cost) Production (5 cents/box – ongoing cost) Implicit Costs: Forgone Wage ($4,000/month) Accounting Costs=Explicit Costs Economic Costs = Explicit+Implicit Costs Sunk Costs= Factory ($200K)
Cost Minimization • One of the goals of a firm is to produce output at a minimum cost. • This minimization goal can be carried out in two situations: • The long run (where all inputs are variable) • The short run (where some inputs are not variable)
The (Long Run) Cost Minimization Problem Suppose that a firm’s owners wish to minimize costs… Let the desired output be Q0 Technology: Q = f(L,K) Owner’s problem: min TC = rK + wL K,L Subject to Q0 = f(L,K)
7.2 The Isocost Line • From the firm’s cost equation: • TC0 = rK + wL • One can obtain the formula for the ISOCOST LINE: • K = TC0/r – (w/r)L • The isocost line graphically depicts all combinations of inputs (labour and capital) that carry the same cost.
K Example: Isocost Lines Direction of increase in total cost TC2/r TC1/r Slope = -w/r TC0/r L TC0/w TC1/w TC2/w
7.3 Cost Minimization Isocost curves are similar to indifference curves, and the tangency condition of cost minimization is also similar to the tangency condition of consumers: MRTSL,K = -MPL/MPK = -w/r
K Example: Cost Minimization TC2/r • Cost inefficient point for Q0 TC1/r Cost minimization point for Q0 TC0/r • Isoquant Q = Q0 L TC0/w TC1/w TC2/w
Cost Minimization Steps • Tangency Condition • - MPL/MPK = w/r-gives relationship between L and K • 2) Substitute into Production Function • -solves for L and K • 3) Calculate Total Cost
Example: Interior Solution • Q = 50L1/2K1/2 • MPL = 25K1/2/L1/2 • MPK = 25L1/2/K1/2 • w = $5 r = $20 • Q0 = 1000 1) Tangency:MPL/MPK = w/r K/L = 5/20…or…L=4K 3) Total Cost: L= 4K L = 40 TC0 = rK + wL TC0 = 20(10) + 5(40) TC0 = 400 2) Substitution: 1000 = 50L1/2K1/2 1000 = 50(4K)1/2K1/2 1000=100K K = 10
K Example: Interior Solution 400/r Cost minimization point • 10 Isoquant Q = 1000 L 40 400/w
Example: Corner Solution • Q = 10L + 2K • MPL = 10 • MPK = 2 • w = $5 • r = $2 • Q0 = 200 • a. MPL/w = 10/5 > MPK /r = 2/2 • But…the “bang for the buck” in labor is larger than the “bang for the buck” in capital… • MPL/w = 10/5 > MPK/r = 2/2 • K = 0; L = 20
Example: Cost Minimization: Corner Solution K Isoquant Q = Q0 • L Cost-minimizing input combination
Comparative Statistics • The isocost line depends upon input prices and desired output • Any change in input prices or output will shift the isocost line • This shift will cause changes in the optimal choice of inputs
Comparative Statics • 1. A change in the relative price of inputs changes the slope of the isocost line. • •All else equal, an increase in w must decrease the cost minimizing quantity of labor and increase the cost minimizing quantity of capital with diminishing MRTSL,K. • All else equal, an increase in r must decrease the cost minimizing quantity of capital and increase the cost minimizing quantity of labor.
Example: Change in Relative Prices of Inputs K Cost minimizing input combination w=2, r=1 • Cost minimizing input combination, w=1 r=1 Isoquant Q = Q0 • 0 L
Example • Originally, MicroCorp faced input prices of $10 for both labor and capital. MicroCorp has a contract with its parent company, Econosoft, to produce 100 units a day through the production function: • Q=2(LK)1/2 • MPL=(K/L)1/2 MPK=(L/K)1/2 • If the price of labour increased to $40, calculate the effect on capital and labour.
Example • If the price of labour quadruples from $10 to $40… • Labour will be cut in half, from 50 to 25 • Capital will double, from 50 to 100
Comparative Statics • An increase in Q0 moves the isoquant Northeast. • The cost minimizing input combinations, as Q0 varies, trace out the expansion path • If the cost minimizing quantities of labor and capital rise as output rises, labor and capital are normal inputs • If the cost minimizing quantity of an input decreases as the firm produces more output, the input is called an inferior input
K Example: An Expansion Path TC2/r TC1/r Expansion path, normal inputs • TC0/r • Isoquant Q = Q0 • L TC0/w TC1/w TC2/w
K Example: An Expansion Path TC2/r Expansion path, labour is inferior • TC1/r • L TC1/w TC2/w
Example • Originally, MicroCorp faced input prices of $10 for both labor and capital. MicroCorp has a contract with its parent company, Econosoft, to produce 100 units a day through the production function: • Q=2(LK)1/2 • MPL=(K/L)1/2 MPK=(L/K)1/2 • If Econosoft demanded 200 units, how would labour and capital change?
Example • If the output required doubled from 100 to 200.. • Labour will double, from 50 to 100 • Capital will double, from 50 to 100 (Constant Returns to Scale)
Input Demand Functions • The demand curve for INPUTS is a schedule of amount of input demanded at each given price level • This demand curve is derived from each individual firm minimizing costs: Definition: The cost minimizing quantities of labor and capital for various levels of Q, w and r are the input demand functions. L = L*(Q,w,r) K = K*(Q,w,r)
K Example: Labour Demand Function • • When input prices (wage and rent, etc) change, the firm maximizes using different combinations of inputs. • Q = Q0 W3/r W2/r W1/r 0 L w As the price of inputs goes up, the firm uses LESS of that input, as seen in the input demand curve • • • L*(Q0,w,r) L1 L2 L3 L
K • • A change in the quantity produced will shift the isoquant curve. • • Q = Q0 • • Q = Q1 0 L w This will result in a shift in the input demand curve. • • • • • L*(Q0,w,r) • L*(Q1,w,r) L1 L2 L3 L
Calculating Input demand functions • Use the tangency condition to find the relationship between inputs: • MPL/MPK = w/rK=f(L) or L=f(K) • 2) Substitute above into production function and solve for other variable: • Q=f(L,K), K=f(L) =>L=f(Q) • Q=f(L,K), L=f(K) =>K=f(Q)
Example: Input demand functions Q = 50L1/2K1/2 MPL/MPK = w/r => K/L = w/r … or… K=(w/r)L This is the equation for the expansion path… Q0 = 50L1/2[(w/r)L]1/2 => L*(Q,w,r) = (Q0/50)(r/w)1/2 K*(Q,w,r) = (Q0/50)(w/r)1/2 • Labor and capital are both normal inputs • Labor is a decreasing function of w • Labor is an increasing function of r
Price Elasticity of Demand (Inputs) • Price elasticity of demand can be calculated for inputs similar to outputs:
Example • JonTech produces the not-so-popular J-Pod. • JonTech faces the following situation: • Q*=5(KL)1/2=100 • MRTS=K/L. • w=$20 and r=$20 • Calculate the Elasticity of Demand for Labour if wages drop to $5.
Example • Initially: • MRTS=K/L=w/r • K=20L/20 • K=L • Q=5(KL)1/2 • 100=5K • 20=K=L
Example • After Wage Change: • MRTS=K/L=w/r • K=5L/20 • 4K=L • Q=5(KL)1/2 • 100=10K • 10=K • 40=L
Example • Price Elasticity of Labour Demand:
7.4 Short Run Cost Minimization Cost minimization occurs in the short run when one input (generally capital) is fixed (K*). Total variable cost is the amount spent on the variable input(s) (ie: wL) -this cost is nonsunk Total fixed cost is the amount spent on fixed inputs (ie: rK*) -if this cost cannot be avoided, it is sunk -if this cost can be avoided, it is nonsunk (ie: rent factory to another firm)
Short Run Cost Minimization Cost minimization in the short run is easy: Min TC=wL+rK* L s.t. the constraint Q=f(L,K*) Where K* is fixed.
Short Run Cost Minimization Example: Minimize the cost to build 80 units if Q=2(KL)1/2 and K=25. Q=2(KL)1/2 80=2(25L)1/2 80=10(L)1/2 8=(L)1/2 64=L Notice that price doesn’t matter.
K Short Run Cost Minimization TC2/r TC1/r Long-Run Cost Minimization • Short-Run Cost Minimization • K* L TC1/w TC2/w
Short Run Expansion Path Choosing 1 input in the short run doesn’t depend on prices, but it does depend on quantity produced. The short run expansion path shows the increased demand for labour as quantity produced increases: (next slide) The demand for inputs will therefore vary according to quantity produced. (The demand curve for inputs shifts when production changes)
K Example: Short and Long Run Expansion Paths TC2/r Long Run Expansion Path TC1/r • TC0/r • • • Short Run Expansion Path K* • L TC0/w TC1/w TC2/w
Short Run and Many Inputs If the Short-Run Minimization problem has 1 fixed input and 2 or more variable inputs, it is handled similarly to the long run situation: