Download
1 / 20
200 likes | 377 Vues
EVENT DETECTION IN TIME SERIES OF MOBILE COMMUNICATION GRAPHS. L eman Akoglu Christos Faloutsos. MOTIVATION. Anomaly and event (change-point) detection, is the building block for many applications:. Cyber warfare Network intrusion Epidemic outbreaks

E N D
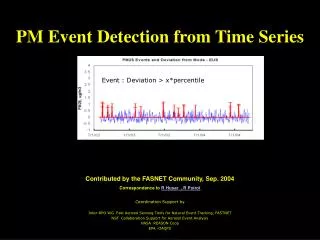
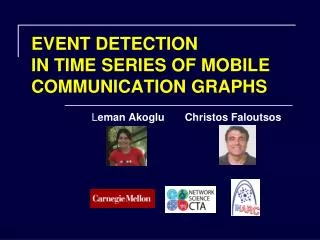
EVENT DETECTION IN TIME SERIES OF MOBILE COMMUNICATION GRAPHS Leman Akoglu Christos Faloutsos
MOTIVATION Anomaly and event (change-point) detection, is the building block for many applications: • Cyber warfare • Network intrusion • Epidemic outbreaks • Fault detection in engineering systems
DATA DESCRIPTION • Texting interactions of mobile phone users from a phone service company in a large city in India • who-texts-whom network • edge-weighted: #SMS • >2 million customers • 50 million SMS interactions • Dec. 1, 2007 to May 31, 2008
PROBLEM STATEMENT Given a graph that changes over time, can we identify: 1) “change detection”: time points at which many of the N nodes change their behavior significantly? 2) “attribution”: top k nodes which contribute to the change in behavior the most?
PROBLEM STATEMENT Two main considerations: • Nis very large (on the order of 106) monitoring each node independently is not practical. • “Anomaly” is defined in a collective setting a time-point/node is anomalous if different than “others”
OVERVIEW OF OUR METHOD • Extract features for nodes • Derive the typical behavior (“eigen-behavior”) of nodes • Compare “eigenbehavior”s over time
FEATURE EXTRACTION egonet Extract features from egonetsfor all nodes • Indegree/outdegree • Inweight/outweight • Number of neighbors • Number of edges • Reciprocal degree • …
DATA IN 3-D Nodes (>2 million) Features (12) Time (183 days)
OVERVIEW OF OUR METHOD • Extract features for nodes • Derive the typical behavior (“eigen-behavior”) of nodes • Compare “eigenbehavior”s over time
DERIVING “EIGEN-BEHAVIOR” N N W N N T T F F:inweight principal eigenvector “typical behavior” “eigen-behavior” active node high score e.g. nodes 1, 2, 6 T
OVERVIEW OF OUR METHOD • Extract features for nodes • Derive the typical behavior (“eigen-behavior”) of nodes • Compare “eigenbehavior”s over time
TRACKING “BEHAVIOR” OVER TIME N N W W N N T T F F:inweight past pattern T change metric: angle θ eigen-behavior at t eigen-behaviors
DETECTED CHANGE POINTS EXPERIMENTS F:inweight Christian New Year Hindi New Year “back to work”
DETECTED CHANGE POINTS EXPERIMENTS F: reciprocal degree F: out-degree Similar behavior for other features
PROBLEM STATEMENT Given a graph that changes over time, can we identify: 1) “change detection”: time points at which many of the N nodes change their behavior significantly? 2) “attribution”: top k nodes which contribute to the change in behavior the most?
ATTRIBUTING CHANGE TO NODES EXPERIMENTS F:inweight DEC 26 no change zone r(t-1) u(t)
ATTRIBUTING CHANGE TO NODES EXPERIMENTS 26 DEC 26 DEC #SMS received time (days) Time series of top 5 nodes marked
ATTRIBUTING CHANGE TO NODES EXPERIMENTS JAN 2 “back to work” reciprocal degree time (days)
CONCLUSION • An algorithm based on tracking “eigenbehavior” patterns over time • “change detection”: spot time-points at which “behavior” changes significantly • “attribution”: spot nodes that cause the most change • Experiments: on real, SMS messages, 2M users, over 6 months
Christian New Year THANK YOU www.cs.cmu.edu/~lakoglu Email: lakoglu@cs.cmu.edu Hindi New Year “back to work” 26 DEC attribution change detection