Anomaly and sequential detection with time series data
Anomaly and sequential detection with time series data. XuanLong Nguyen xuanlong@eecs.berkeley.edu CS 294 Practical Machine Learning Lecture 10/30/2006. Outline. Part I: Anomaly detection in time series unifying framework for anomaly detection methods

Anomaly and sequential detection with time series data
E N D
Presentation Transcript
Anomaly and sequential detection with time series data XuanLong Nguyen xuanlong@eecs.berkeley.edu CS 294 Practical Machine Learning Lecture 10/30/2006
Outline • Part I: Anomaly detection in time series • unifying framework for anomaly detection methods • applying techniques you have already learned so far in the class • clustering, pca, dimensionality reduction • classification • probabilistic graphical models (HMM,..) • hypothesis testing • Part 2: Sequential analysis (detecting the trend, not the burst) • framework for reducing the detection delay time • intro to problems and techniques • sequential hypothesis testing • sequential change-point detection
Anomalies in time series data • Time series is a sequence of data points, measured typically at successive times, spaced at (often uniform) time intervals • Anomalies in time series data are data points that significantly deviate from the normal pattern of the data sequence
Telephone usage data Network traffic data 6:12pm 10/30/2099 Matrix code Examples of time series data Inhalational disease related data
Telephone usage data Potentially fradulent activities Network traffic data 6:11 10/30/2099 Matrix code Anomaly detection
Applications • Failure detection • Fraud detection (credit card, telephone) • Spam detection • Biosurveillance • detecting geographic hotspots • Computer intrusion detection • detecting masqueraders
Time series • What is it about time series structure • Stationarity (e.g., markov, exchangeability) • Typical stochastic process assumptions (e.g., independent increment as in Poisson process) • Mixtures of above • Typical statistics involved • Transition probabilities • Event counts • Mean, variance, spectral density,… • Generally likelihood ratio of some kind • We shall try to exploit some of these structures in anomaly detection tasks Don’t worry if you don’t know all of these terminologies!
List of methods • clustering, dimensionality reduction • mixture models • Markov chain • HMMs • mixture of MC’s • Poisson processes
Anomaly detection outline • Conceptual framework • Issues unique to anomaly detection • Feature engineering • Criteria in anomaly detection • Supervised vs unsupervised learning • Example: network anomaly detection using PCA • Intrusion detection • Detecting anomalies in multiple time series • Example: detecting masqueraders in multi-user systems
Conceptual framework • Learn a model of normal behavior • Using supervised or unsupervised method • Based on this model, construct a suspicion score • function of observed data (e.g., likelihood ratio/ Bayes factor) • captures the deviation of observed data from normal model • raise flag if the score exceeds a threshold
Potentially fradulent activities Example: Telephone traffic (AT&T) [Scott, 2003] • Problem: Detecting if the phone usage of an account is abnormal or not • Data collection: phone call records and summaries of an account’s previous history • Call duration, regions of the world called, calls to “hot” numbers, etc • Model learning: A learned profile for each account, as well as separate profiles of known intruders • Detection procedure: • Cluster of high fraud scores between 650 and 720 (Account B) Account A Account B Fraud score Time (days)
Criteria in anomaly detection • False alarm rate (type I error) • Misdetection rate (type II error) • Neyman-Pearson criteria • minimize misdetection rate while false alarm rate is bounded • Bayesian criteria • minimize a weighted sum for false alarm and misdetection rate • (Delayed) time to alarm • second part of this lecture
Feature engineering • identifying features that reveal anomalies is difficult • features are actually evolving attackers constantly adapt to new tricks, user pattern also evolves in time
Feature choice by types of fraud • Example: Credit card/telephone fraud • stolen card: unusual spending within short amount of time • application fraud (using false information): first-time users, amount of spending • unusual called locations • “ghosting”: fraudster tricks the network to obtain free cards • Other domains: features might not be immediately indicative of normal/abnormal behavior
From features to models • More sophisticated test scores built upon aggregation of features • Dimensionality reduction methods • PCA, factor analysis, clustering • Methods based on probabilistic • Markov chain based, hidden markov models • etc
Supervised vs unsupervised learning methods • Supervised methods (e.g.,classification): • Uneven class size, different cost of different labels • Labeled data scarce, uncertain • Unsupervised methods (e.g.,clustering, probabilistic models with latent variables such as HMM’s)
Perform PCA on 41-dim data Select top 5 components Network traffic data anomalies threshold Example: Anomalies off the principal components [Lakhina et al, 2004] Abilene backbone network traffic volume over 41 links collected over 4 weeks Projection to residual subspace
Anomaly detection outline • Conceptual framework • Issues unique to anomaly detection • Example: network anomaly detection using PCA • Intrusion detection • Detecting anomalies in multiple time series • Example: detecting masqueraders in multi-user computer systems
Intrusion detection(multiple anomalies in multiple time series)
Broad spectrum of possibilities and difficulties • Trusted system users turning from legitimate usage to abuse of system resources • System penetration by sophisticated and careful hostile outsiders • One-time use by a co-worker “borrowing” a workstation • Automated penetrations by relatively naïve attacker via scripted attack sequences • Varying time spans from few seconds to months • Patterns might appear only in data gathered in distantly distributed sources • What sources? Command data, system call traces, network activity logs, CPU load averages, disk access patterns? • Data corrupted by noise or interspersed with examples of normal pattern usage
Intrusion detection • Each user has his own model (profile) • Known attacker profiles • Updating: Models describing user behavior allowed to evolve (slowly) • Reduce false alarm rate dramatically • Recent data more valuable than old ones
Framework for intrusion detection D: observed data of an account C: event that a criminal present, U: event account is controlled by user P(D|U): model of normal behavior P(D|C): model for attacker profiles By Bayes’ rule • p(D|C)/p(D|U) is known as the Bayes factor for criminal activity • (or likelihood ratio) • Prior distribution p(C) key to control false alarm • A bank of n criminal profiles (C1,…,Cn) • One of the Ci can be a vague model to guard against future attack
Simple metrics • Some existing intrusion detection procedures not formally expressed as probabilistic models • one can often find stochastic models (under our framework) leading to the same detection procedures • Use of “distance metric” or statistic d(x) might correspond to • Gaussian p(x|U) = exp(-d(x)^2/2) • Laplace p(x|U) = exp(-d(x)) • Procedures based on event counts may often be represented as multinomial models
Intrusion detection outline • Conceptual framework of intrusion detection procedure • Example: Detecting masqueraders • Probabilistic models • how models are used for detection
Markov chain based modelfor detecting masqueraders [Ju & Vardi, 99] • Modeling “signature behavior” for individual users based on system command sequences • High-order Markov structure is used • Takes into account last several commands instead of just the last one • Mixture transition distribution • Hypothesis test using generalized likelihood ratio
Data and experimental design • Data consist of sequences of (unix) system commands and user names • 70 users, 150,000 consecutive commands each (=150 blocks of 100 commands) • Randomly select 50 users to form a “community”, 20 outsiders • First 50 blocks for training, next 100 blocks for testing • Starting after block 50, randomly insert command blocks from 20 outsiders • For each command block i (i=50,51,...,150), there is a prob 1% that some masquerading blocks inserted after it • The number x of command blocks inserted has geometric dist with mean 5 • Insert x blocks from an outside user, randomly chosen
sh ls cat pine others 1% use . . . C1 C2 Cm C 10 comds Markov chain profile for each user Consider the most frequently used command spaces to reduce parameter space K = 5 Higher-order markov chain m = 10 Mixture transition distribution Reduce number of paras from K^m to K^2 + m (why?)
Testing against masqueraders Given command sequence Learn model (profile) for each user u Test the hypothesis: H0 – commands generated by user u H1 – commands NOT generated by user u Test statistic (generalized likelihood ratio): Raise flag whenever X > some threshold w
with updating (163 false alarms, 115 missed alarms, 93.5% accuracy) + without updating (221 false alarms, 103 missed alarms, 94.4% accuracy) Masquerader blocks missed alarms false alarms
Results by users Missed alarms False alarms threshold Masquerader block Test statistic
Results by users Masquerader block threshold Test statistic
Take-home message (again) • Learn a model of normal behavior for each monitored individuals • Based on this model, construct a suspicion score • function of observed data (e.g., likelihood ratio/ Bayes factor) • captures the deviation of observed data from normal model • raise flag if the score exceeds a threshold
Other models in literature • Simple metrics • Hamming metric [Hofmeyr, Somayaji & Forest] • Sequence-match [Lane and Brodley] • IPAM (incremental probabilistic action modeling) [Davison and Hirsh] • PCA on transitional probability matrix [DuMouchel and Schonlau] • More elaborate probabilistic models • Bayes one-step Markov [DuMouchel] • Compression model • Mixture of Markov chains [Jha et al] • Elaborate probabilistic models can be used to obtain answer to more elaborate queries • Beyond yes/no question (see next slide)
Burst modeling using Markov modulated Poisson process [Scott, 2003] • can be also seen as a nonstationary discrete time HMM (thus all inferential machinary in HMM applies) • requires less parameter (less memory) • convenient to model sharing across time Poisson process N0 binary Markov chain Poisson process N1
Detection results Uncontaminated account Contaminated account probability of a criminal presence probability of each phone call being intruder traffic
Outline Anomaly detection with time series data Detecting bursts Sequential detection with time series data Detecting trends
Sequential analysis:balancing the tradeoff between detection accuracy and detection delay XuanLong Nguyen xuanlong@eecs.berkeley.edu Radlab, 11/06/06
Outline • Motivation in detection problems • need to minimize detection delay time • Brief intro to sequential analysis • sequential hypothesis testing • sequential change-point detection • Applications • Detection of anomalies in network traffic (network attacks), faulty software, etc
Three quantities of interest in detection problems • Detection accuracy • False alarm rate • Misdetection rate • Detection delay time
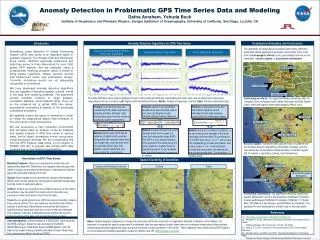
Network volume anomaly detection [Huang et al, 06]
So far, anomalies treated as isolated events • Spikes seem to appear out of nowhere • Hard to predict early short burst • unless we reduce the time granularity of collected data • To achieve early detection • have to look at medium to long-term trend • know when to stop deliberating
Early detection of anomalous trends • We want to • distinguish “bad” process from good process/ multiple processes • detect a point where a “good” process turns bad • Applicable when evidence accumulates over time (no matter how fast or slow) • e.g., because a router or a server fails • worm propagates its effect • Sequential analysis is well-suited • minimize the detection time given fixed false alarm and misdetection rates • balance the tradeoff between these three quantities (false alarm, misdetection rate, detection time) effectively
Example: Port scan detection (Jung et al, 2004) • Detect whether a remote host is a port scanner or a benign host • Ground truth: based on percentage of local hosts which a remote host has a failed connection • We set: • for a scanner, the probability of hitting inactive local host is 0.8 • for a benign host, that probability is 0.1 • Figure: • X: percentage of inactive local hosts for a remote host • Y: cumulative distribution function for X 80% bad hosts
Hypothesis testing formulation • A remote host R attempts to connect a local host at time i let Yi = 0 if the connection attempt is a success, 1 if failed connection • As outcomes Y1, Y2,… are observed we wish to determine whether R is a scanner or not • Two competing hypotheses: • H0: R is benign • H1: R is a scanner
An off-line approach • Collect sequence of data Y for one day (wait for a day) 2. Compute the likelihood ratio accumulated over a day This is related to the proportion of inactive local hosts that R tries to connect (resulting in failed connections) 3. Raise a flag if this statistic exceeds some threshold
Stopping time A sequential (on-line) solution • Update accumulative likelihood ratio statistic in an online fashion 2. Raise a flag if this exceeds some threshold Acc. Likelihood ratio Threshold a Threshold b 0 24 hour
Comparison with other existing intrusion detection systems (Bro & Snort) 0.963 0.040 4.08 1.000 0.008 4.06 • Efficiency: 1 - #false positives / #true positives • Effectiveness: #false negatives/ #all samples • N: # of samples used (i.e., detection delay time)
Two sequential decision problems • Sequential hypothesis testing • differentiating “bad” process from “good process” • E.g., our previous portscan example • Sequential change-point detection • detecting a point(s) where a “good” process starts to turn bad
Sequential hypothesis testing • H = 0 (Null hypothesis): normal situation • H = 1 (Alternative hypothesis): abnormal situation • Sequence of observed data • X1, X2, X3, … • Decision consists of • stopping time N (when to stop taking samples?) • make a hypothesis H = 0 or H = 1 ?
Quantities of interest • False alarm rate • Misdetection rate • Expected stopping time (aka number of samples, or decision delay time) E N • Frequentist formulation: Bayesian formulation: