Download
1 / 51
510 likes | 797 Vues
Chapter 15: Surveying the Stars. How can we Study the Life Cycles of Stars?. A star can live for millions to billions of years. we will never observe a particular star evolve from birth to death so how can we study stellar evolution? The key is that all stars were not born at the same time.

E N D
How can we Study the Life Cycles of Stars? A star can live for millions to billions of years. • we will never observe a particular star evolve from birth to death • so how can we study stellar evolution? The key is that all stars were not born at the same time. • the stars which we see today are at different stages in their lives • we observe only a brief moment in any one star’s life • by studying large numbers of stars, we get a “snapshot” of one moment in the history of the stellar community • we can draw conclusions just like we would with human census data…we do stellar demographics! The stars we observe also have different masses. • by counting stars of different masses, we can determine how long stars of a given mass remain in a certain stage of life
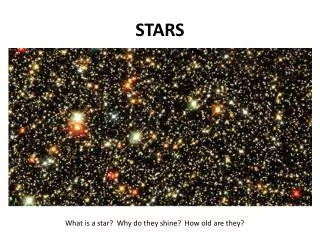
Classification of Stars Stars were originally classified based on: • their brightness • their location in the sky This classification is still reflected in the names of the brightest stars…those we can see with our eyes: Order of brightness within a constellation Latin Genitive of the constellation Orionis Geminorum
Classification of Stars The old classification scheme told us little about a star’s true (physical) nature. • a star could be very bright because is was very close to us; not because it was truly bright • two stars in the same constellation might not be close to each other; one could be much farther away In the 20th Century, astronomers developed a more appropriate classification system based on: • a star’s luminosity • a star’s surfacetemperature Since these properties depend on a star’s mass and its stage in life: • measuring them allows us to reconstruct stellar life cycles
Luminosity of Stars Luminosity – the total amount of power radiated by a star into space. Apparent brightness refers to the amount of a star’s light which reaches us per unit area. • the farther away a star is, the fainter it appears to us • how much fainter it gets obeys an inverse square law • its apparent brightness decreases as the (distance)2 • The apparent brightness of a star depends on two things: • How much light is it emitting: luminosity (L) [watts] • How far away is it: distance (d) [meters] App Bright = L / 4d2
Apparent Brightness The Inverse Square Law for Light What Determines Apparent Brightness?
Measuring Distances to Stars parallax – apparent wobble of a star due to the Earth’s orbiting of the Sun
Measuring Distances to Stars This is a right triangle sin p = 1 AU/ d if p << 1; sin p p d = 1 AU/ p convert p into arcsec d = 206,265 AU/ p
Measuring Distances to Stars let’s define 1 parsec 206,265 A.U. = 3.26 light years d = 1 / p If p is in arcsec and d is in parsecs A star with a parallax of 1 arcsec is 1 parsec distant
The Brightness of Stars Astronomers still use an ancient method for measuring stellar brightness which was proposed by the Greek astronomer Hipparchus (c. 190 – 120 B.C.) Magnitude Scale This scale runs backwards: The bigger the number, the fainter the star Brightest stars are #1, next brightest are #2, etc.
The Modern Magnitude System apparent magnitude = -2.5 log (app bright) • brightness of a star as it appears from Earth • each step in magnitude is 2.5 times in brightness absolute magnitude • the apparent magnitude a star would have if it were 10 pc away
Colors of Stars Stars come in many different colors. The color tells us the star’s temperature according to Wien’s Law. Bluer means hotter!
Spectral Type Classification System O BAFGKM (L) • Our Best Astronomers Feel Good Knowing More • Oh Boy! An F Grade Kills Me! • Oh Be A Fine Girl (Guy), Kiss Me! 50,000 K 3,000 K Temperature
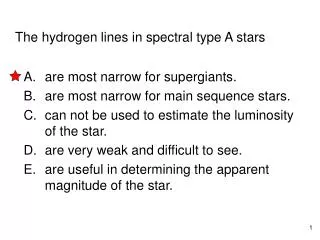
Spectral Types of Stars Spectral types are defined by the: • existence of absorption lines belonging to various elements, ions, & molecules in a star’s spectrum • the relative strengths of these line However, spectral type is not determined by a star’s composition. • all stars are made primarily of Hydrogen & Helium Spectral type is determined by a star’s surface temperature. • temperature dictates the energy states of electrons in atoms • temperature dictates the types of ions or molecules which exist • this, in turn, determines the number and relative strengths of absorption lines in the star’s spectrum • this fact was discovered by Cecilia Payne-Gaposchkin in 1925
Masses of Stars Mass is the single most important property of any star. • at each stage of a star’s life, mass determines… • what its luminosity will be • what its spectral type will be The mass of a star can only be measured directly by … • observing the effect which gravity from another object has on the star This is most easily done for two stars which orbit one another…a binary star!
Binary Stars(two stars which orbit one another) Optical doubles • two unrelated stars which are in the same area of the sky Visual binaries • a binary which is spatially resolved, i.e. two stars are seen (e.g.Sirius)
Binary Stars Spectroscopic binaries • a binary which is spatially unresolved, i.e only one star is seen; the existence of the second star is inferred from the Doppler shift of lines.
Binary Stars Eclipsing binaries • a binary whose orbital plane lies along our line of sight, thus causing “dips” in the light curve.
Binary Stars • The stars orbit each other via gravity. • So the laws of Kepler & Newton apply! • Remember Newton’s version of Kepler’s Third Law: P2 = 42 a3 / G (m1 + m2) • If you can measure the orbital period of the binary (P) and the distance between the stars (a), then you can calculate the sum of the masses of both stars (m1 + m2).
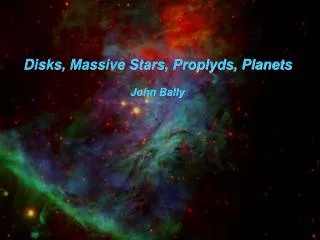
Mass transfer in close binary systems can produce unusual double stars Close binary systems are where only a few stellar diameters, or less, separate the stars Mass can be dramatically transferred between the stars - detached binary (no mass transfer) - semidetached binary(material can flow across along a path called the Roche lobe) - contact binary (the two stars share a common envelope of material)
The Hertzsprung-Russell Diagram • What is the Hertzsprung-Russell (HR) diagram? • What are the major features of the HR diagram? • How do stars differ along the main sequence? • What determines the length of time a star spends on the main sequence? • What are Cepheid variable stars and why are they important to astronomers? Our goals for learning:
The Hertzsprung-Russell Diagram • A very useful diagram for understanding stars • We plot two major properties of stars: • Temperature (x) vs. Luminosity (y) • Spectral Type (x) vs. Absolute Magnitude (y) • Stars tend to group into certain areas bright MV faint Spectral type hot cool
BRIGHT HOT COOL FAINT
The Main Sequence (MS) 90% of all stars lie on the main sequence!
Stellar Luminosity • How can two stars have the same temperature, but vastly different luminosities? • The luminosity of a star depends on 2 things: • surface temperature • surface area (radius) • L = T4 4 R2 • The stars have different sizes!! • The largest stars are in the upper right corner of the H-R Diagram.
Stellar Luminosity Classes Class I includes all the supergiants Class V includes the main sequence stars e.g., the Sun is a G2 V If you know the spectral type and luminosity class you can also use this to measure the distance to stars millions of light years away
Mass-Luminosity Relation We use binary stars to measure directly the masses of stars of every type. This leads to the: L m3.5 for main sequence stars only • As one moves to the upper-left of the main sequence: • stars become more massive • stars become even much more luminous • stars become fewer in number
There is a relationship between mass and luminosity for main-sequence stars Bigger is brighter!
Mass–Luminosity Relation All main sequence stars fuse H into He in their cores. Luminosity depends directly on mass because: • more mass means more weight from the star’s outer layers • nuclear fusion rates must be higher in order to maintain gravitational equilibrium
Lifetime on the Main Sequence How long will it be before MS stars run out of fuel? i.e. Hydrogen? M How much fuel is there? L M3.5 How fast is it consumed? How long before it is used up? M/L = M/M3.5 = M-2.5
Lifetime on the Main Sequence • O & B Dwarfs burn fuel like a bus! • M Dwarfs burn fuel like a compact car! • Our Sun will last 1010 years on the Main Sequence • MS Lifetime = 1010 yrs / M2.5
Lifetime on the Main Sequence So for example: B2 dwarf (10 M) lasts 3.2 x 10⁷ yr F0 dwarf (2 M) lasts 1.8 x 10⁹ yr M0 dwarf (.5 M) lasts 5.6 x 10¹⁰ yr But the Universe is 1.37 x 10¹⁰ yr old! Every M dwarf that was ever created is still on the main sequence!!
Cepheid Variables She studied the light curves of variable stars in the Magellenic clouds. Henrietta Leavitt (1868-1921) Same distance
Cepheid Variables The brightness of the stars varied in a regular pattern.
Cepheid Variables prototype: Cephei F - G Bright Giants (II) whose pulsation periods (1-100 days) get longer with brightness (MV = -2 to -6) Distance Indicator!!
Cepheid Variables Cepheids enable astronomers to estimate vast distances • This period-luminosity relationship is important because if an astronomer can find a Cepheid and measure its period, she can determine its luminosity and absolute magnitude. • Comparing the absolute and apparent magnitudes allows for the distance to be calculated.
Cepheids enable astronomersto estimate vast distances This period-luminosity relationship is important because if an astronomer can find a Cepheid and measure its period, she can determine its luminosity and absolute magnitude. Comparing the absolute and apparent magnitudes allows for the distance to be calculated.
The Instability Strip There appears to be an almost vertical region on the H-R Diagram where all stars within it (except on the Main Sequence) are variable. They pulsate due to partial ionization!
Open Clusters • 100’s of stars • 106 - 109 years old • irregular shapes • gas or nebulosity is sometimes seen Pleaides (8 x 10⁷ yrs)
Globular Clusters • 105 stars • 8 to 15 billion years old (1010 yrs) • spherical shape • NO gas or nebulosity M 80 (1.2 x 10¹⁰ yrs)
Clusters are useful for studying stellar evolution! • all stars are the same distance • use apparent magnitudes • all stars formed at about the same time • they are the same age Plot an H-R Diagram!
Pleiades H-R Diagram Globular Cluster H-R Diagram Palomar 3
Cluster H-R Diagrams Indicate Age • All stars arrived on the MS at about the same time. • The cluster is as old as the most luminous (massive) star left on the MS. • All MS stars to the left have already used up their H fuel and are gone. • The position of the hottest, brightest star on a cluster’s main sequence is called the main sequence turnoff point.