Download
1 / 41
410 likes | 656 Vues
IMPACTS OF EUROPEAN INTEGRATION ON THE AGRICULTURE OF CENTRAL AND EASTERN EUROPEAN COUNTRIES. Prof. Csaba Csaki Corvinus University of Budapest, 28 , April 20 10 Novisad. OUTLINE. Characteristics of changes Production performance Trade balance Prices-incomes Underlying factors

E N D
IMPACTS OF EUROPEAN INTEGRATION ON THE AGRICULTURE OF CENTRAL AND EASTERN EUROPEAN COUNTRIES Prof. Csaba Csaki Corvinus University of Budapest, 28, April 2010 Novisad
OUTLINE • Characteristics of changes • Production performance • Trade balance • Prices-incomes • Underlying factors • Initial conditions • Pre-accession policies • Post-accession policies • Conclusions
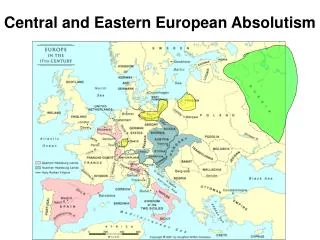
EE LV LT PL CZ SK HU SI OVERVIEW: Comparison EU-15/ EU-12 in 2007 EU-15 EU-12 145 million ha of UAA 6,2 million workers (3,7% of total workforce) 5 operators per 100 ha of UAA 37 million ha of UAA 6,32 million workers (9,3% of total workforce) 6,25 operators per 100 ha of UAA 1:16 (farmer/consumer) 1:63 (farmer/consumer) SK RO BG Consumer: 100 million Per capita GDP: 15 100 € Household income spent on food: 24% Consumer: 390 million Per capita GDP: 26 300 € Household income spent on food: 15%
PRODUCTION PERFORMANCE • Declining role of agriculture • Modest impact on overall production • Fluctuating land productivity with remaining gaps • Increased labour productivity • Movement toward more extensive structures • Limited progress in the livestock sector
ROLE OF AGRICULTUREShare of agriculture in GDP in CEE(%) Source: Own composition based on World Bank (2009)
PRODUCTION PERFORMANCE • Declining role of agriculture • Modest impact on overall production • Fluctuating land productivity with remaining gaps • Increased labour productivity • Movement toward more extensive structures • Limited progress in the livestock sector
INDEX OF AGRICULTURAL OUPUT IN REAL VALUE (2000=100) Source: Own composition based on EUROSTAT (2009)
CEREAL PRODUCTIONTop 7 producers’ production of cereals in EU10+2 (tonnes) Source: Own composition based on EUROSTAT (2009)
MEAT PRODUCTIONTop 7 producers’ production of meat (cattle, goat, pig) in EU10+2 (tonnes) Source: Own composition based on EUROSTAT (2009)
MILK PRODUCTIONTop 7 producers’ production of fresh cow milk in EU10+2 (tonnes) Source: Own composition based on EUROSTAT (2009)
PRODUCTION PERFORMANCE • Declining role of agriculture • Modest impact on overall production • Fluctuating land productivity with remaining gaps • Increased labour productivity • Movement toward more extensive structures • Limited progress in the livestock sector
AGRICULTURAL OUTPUT (euro/ha) Source: Own composition based on Eurostat (2009)
PRODUCTIVITY Yields of cereals in NMS (tonnes/ha) Source: Own composition based on FAO (2009)
PRODUCTION PERFORMANCE • Declining role of agriculture • Modest impact on overall production • Fluctuating yields with remaining gaps • Increased labour productivity • Movement toward more extensive structures • Limited progress in the livestock sector
AGRICULTURAL GROSS VALUE ADDED AT BASIC PRICE per total annual work unit, 2003-07 Source: Dieter Kirschke (2009), Presentation in Berlin, MACE Conference, January 2009
PRODUCTION PERFORMANCE • Declining role of agriculture • Modest impact on overall production • Fluctuating yields with remaining gaps • Increased labour productivity • Movement toward more extensive structures • Limited progress in the livestock sector
INTENSIFICATION Rate of crop, livestock and other output in total output, 2006 (%) Source: Own composition based on FADN (2009)
MORE TRADE, MORE COMPETITION • Both exports and imports increased • Strong differences • Poland significant increase in net exports • Hungary and Lithuania also net exporters • The rest: increasing deficit • High and increasing share of row-materials in exports • Increased share of imported processed products on the domestic markets
AGRI-FOOD AND BEVERAGES EXPORT(million USD) Source: Own composition based on EUROSTAT (2009)
AGRI-FOOD AND BEVERAGES TRADE BALANCE(million USD) Source: Own composition based on EUROSTAT (2009)
MORE TRADE, MORE COMPETITION • Both exports and imports increased • Strong differences • Poland significant increase in net exports • Hungary and Lithuania also net exporters • The rest: increasing deficit • High and increasing share of row-materials in exports • Increased share of imported processed products on the domestic markets
RAW MATERIALS IN TOTAL AGRI-FOOD AND BEVERAGES (%) Source: Own composition based on EUROSTAT (2009)
PRICES-INCOMES • Significant increase of nominal producer prices • Real producer prices remained below EU-15 levels • Price adjustment larger in countries with lower pre-accession levels • Significant increase of farming incomes with remaining initial differences in levels
WHEAT PRODUCER PRICES, USD/tonnes Source: Own composition based on FAO (2009)
PIG MEAT PRODUCER PRICES, USD/tonnes Source: Own composition based on FAO (2009)
MILK PRODUCER PRICES, Fresh cow milk, USD/tonnes Source: Own composition based on FAO (2009)
PRICES-INCOMES • Significant increase of nominal producer prices • Real producer prices remained below EU-15 levels • Price adjustment larger in countries with lower pre-accession levels • Significant increase of farming incomes with remaining initial differences in levels
GROSS FARM INCOME PER HECTARE (euro/ha) Source: Own composition based on FADN (2009)
INITIAL CONDITIONS • Significant land resources with varying quality • Large but fast declining labour force except Poland • Dual farming structure in five countries • Majority of small farming in the other five countries • Significant differences in initial asset stock
LABOUR FORCE:Agricultural labour in 1000 annual work units (absolute numbers) Source: Own composition based on EUROSTAT(2009)
FARM STRUCTUREbased on land use in NMS Source: Own composition based on EUROSTAT(2009)
FARM SIZESUAA by sizes (ha) in 2007 Source: Own composition based on Eurostat (2009)
ASSETS:Total assets/Utilised Agricultural Area in 2006 (€/ha) Source: Own composition based on FADN (2009)
PRE-ACCESSION POLICIES Positive impacts: • Competitiveness enhancement • Low level of PSE • Liberal land policies • Production focused SAPARD priorities Negative impacts: • Excessive price and market support • High intensity of support • Restrictive land and farm policies • Lack of land and farm consolidation
DEVELOPMENT OF THE PRODUCER SUPPORT ESTIMATE IN NMS, 1990 - 2006 Source: Dieter Kirschke (2009)
POST ACCESSION POLICIES • CAP/SAPS except Slovenia • Diverging top up • Diverging pillar 2 priorities • Grain market-intervention • Efficiency of implementation • Impact of macro policies
SUBSIDIES:Direct payments in NMS, 2007 Source: Dieter Kirschke (2009)
SUBSIDIES: National expenditures for agriculture per 1 hectare of agricultural land in 2006 (1000 euro) Source: Own composition based on EUROSTAT (2009)
POST ACCESSION POLICIES • CAP/SAPS except Slovenia • Diverging top up • Diverging pillar 2 priorities • Grain market-intervention • Efficiency of implementation • Impact of macro policies
CONCLUSIONS • Overall positive impact • Diversity due to • Initial conditions • Pre-accession policies • Post-accession policies • Farming structure: consolidated structures have an advantage • Small farmers are handicapped • Limited potentials to withhold competitive pressures • One fits to all?