Download

1 / 35
350 likes | 474 Vues
REVIEW OF UNIT 1. 1) The table displays the number of videos rented. a. How many families were surveyed?. 16 + 14 + 11 + 2 + 4 = 47. REVIEW OF UNIT 1. 1) The table displays the number of videos rented. b. Find the median number of videos rented by these families.

E N D
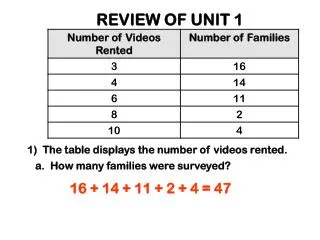
REVIEW OF UNIT 1 1) The table displays the number of videos rented. a. How many families were surveyed? 16 + 14 + 11 + 2 + 4 = 47
REVIEW OF UNIT 1 1) The table displays the number of videos rented. b. Find the median number of videos rented by these families. Median # of families: 47+1 / 2= 48 / 2 = 24 Since 16 families rented 3 videos, the 24 families would fall into the 4- video category. 16 + 14 = 30
REVIEW OF UNIT 1 1) The table displays the number of videos rented. c. Find the mean number of videos rented by these families.
2) The histogram below shows the ages of the people attending the showing of a movie. 60 55 20 15 10 10 5 5 2 a. How many people attended this move? 5 + 60 + 55 + 20 + 10 + 15 + 10 + 5 + 2 = 182
2) The histogram below shows the ages of the people attending the showing of a movie. 60 55 20 15 10 10 5 5 2 b. Circle the interval below that contains the mean age of the people attending this movie. Explain how you can make this choice without actually computing the mean. 5-10 years old 15-20 years old 30-35 years old
2) HOW TO COMPUTE MEAN FROM HISTOGRAM: 60 55 20 15 10 10 5 5 2 32.5 37.5 7.5 67.5 17.5 2.5 12.5 42.5 72.5 1) Find the central value of each bin (interval).
2) HOW TO COMPUTE MEAN FROM HISTOGRAM: 60 55 20 15 10 10 5 5 2 32.5 37.5 7.5 67.5 17.5 2.5 12.5 42.5 72.5 2) Multiply central value times the entries in that bin and add the products: 2.5(5) + 7.5(60) + 12.5(55) + 17.5(20) + 32.5(10) + 37.5(15) +42.5(10) + 67.5(5) + 72.5(2) = 2945
2) HOW TO COMPUTE MEAN FROM HISTOGRAM: 60 55 Mean age: 16.18 20 15 10 10 5 5 2 32.5 37.5 7.5 67.5 17.5 2.5 12.5 42.5 72.5 3) Divide this sum by total entries: This means that the mean age is 16.18 which falls beteen 15-20.
2) The histogram below shows the ages of the people attending the showing of a movie. 60 55 20 15 10 10 5 5 2 c. Approximately, what is the median? Since 182 people attended, the median number of people is (182+1) / 2 = 183 / 2 = 91.5. Since 5 people are in the first bin, 60 people are in the second bin (5 + 60 = 65), then the 91.5 person has to lie in the third bin about ½ way through. This is the 10-15 age range. 12.5 is the age about ½ way into this 10-15 interval.
2) The histogram below shows the ages of the people attending the showing of a movie. 60 55 20 15 10 10 5 5 2 d. Approximately, what is the mean?
2) The histogram below shows the ages of the people attending the showing of a movie. 60 55 Median age: 12.5 26.5 41.25 28.5 20 15 10 10 5 5 2 Q1:7 12.5 e. Draw an approximate box-whiskers plot for the histogram. Compute Q1: Find the number of people halfway from the minimum to the median (91.5 + 1) / 2 = 46.25 Counting over from the minium, Q1 should fall around 7 or 8.
2) The histogram below shows the ages of the people attending the showing of a movie. 60 55 Median age: 12.5 26.5 41.25 28.5 20 15 10 10 5 5 2 Q1:7 Q3:7 12.5 e. Draw an approximate box-whiskers plot for the histogram. Compute Q3: Find the number of people halfway from the median to the maximum (91.5 + 1) / 2 = 46.25 Counting over from the median, Q3 should fall around 19 or 20.
2) The histogram below shows the ages of the people attending the showing of a movie. 60 55 Median age: 12.5 26.5 41.25 28.5 20 15 10 10 5 5 2 min max Q1:7 Q3:7 12.5 e. Draw an approximate box-whiskers plot for the histogram. All values for the box and whisker plot are now labeled in the histogram. Min: 0 Max: 75 Q1: 7 Q3: 20 Q2: 12.5
2) The histogram below shows the ages of the people attending the showing of a movie. f. Describe the spread in the data. Skewed right
3) IQR = Q3 – Q1 = 4 – 1.7 = 2.3 .4 20.1 1.7 2.6 4 (a.) Are there any outliers? Explain how you know. HOW TO DETERMINE IF THERE IS(ARE) OUTLIERS: If any value lies beyond either of the following, then these are outliers. If no value lies beyond either of the following, then there are no outliers. Q1 – IQR(1.5) = 1.7 – 2.3(1.5) = 1.7 – 3.45 = - 1.75 No outlier to the left of Q1 Q3 + IQR(1.5) = 4 + 2.3(1.5) = 4 + 3.45 = 7.45 Since 20.1 lies to the right of 7.45, 20.1 is an outlier.
3) The box plot below shows the number of licensed drivers (in millions) for 25 states in the United States. The minimum value is 0.4 million, the lower quartile is 1.7 million, the median is 2.6 million, the upper quartile is 4.0 million, and the maximum is 20.1 million. (b.) Describe the shape of the distribution. Explain your reasoning. Skewed right
3) The box plot below shows the number of licensed drivers (in millions) for 25 states in the United States. The minimum value is 0.4 million, the lower quartile is 1.7 million, the median is 2.6 million, the upper quartile is 4.0 million, and the maximum is 20.1 million. (c.) How many of these states have more than 4 million licensed drivers? Explain how you know. 25 % of the values lie above Q3. So 25(.25) = 6.25 states
3) (d.) Draw an appropriate histogram that matches this box and whisker plot.
Tamika kept track of the number of minutes that she exercised each day for two months. The distribution was approximately normal. She calculated the following summary statistics. • Mean = 35 minutes, median = 34 minutes, • standard deviation = 8 minutes, lower quartile = 24 minutes, and upper quartile = 41 minutes (a.) Find the interquartile range and write a sentence that describes what it tells you about Tamika’s exercise times. IQR = Q3 – Q1 = 41 – 24 = 17 50 % of her exercise minutes fell within this range
Tamika kept track of the number of minutes that she exercised each day for two months. The distribution was approximately normal. She calculated the following summary statistics. • Mean = 35 minutes, median = 34 minutes, • standard deviation = 8 minutes, lower quartile = 24 minutes, and upper quartile = 41 minutes (b.) Suppose that she ran five more minutes each day for the next two months. What would the new quartiles be? Mean: Median: Standard Deviation: IQR: 39 40 17 8
Jack’s homework grades are 75, 78, 96, 94, 93, 100, 101, 93, 60, 65, 64, 62, 73, 85, 87. • Find the: 60, 62, 64, 65, 73, 75, 78, 85, 87, 93, 93, 94, 96, 100, 101 81.73 a.) mean b.) median 85 c.) mode 93 d.) range 101 – 60 = 41 e.) IQR Q3 – Q1 = 94 – 65 = 29
Jack’s homework grades are 75, 78, 96, 94, 93, 100, 101, 93, 60, 65, 64, 62, 73, 85, 87. • Find the: 60, 62, 64, 65, 73, 75, 78, 85, 87, 93, 94, 96, 100, 101 f.) standard deviation 14.49 or 14.006
60 70 80 90 100 110 • Jack’s homework grades are 75, 78, 96, 94, 93, 100, 101, 93, 60, 65, 64, 62, 73, 85, 87. • Make a histogram and a box plot that displays his homework grades. max 101 min 60 Q1 65 Q2 85 Q3 94
6) The box plots below show the ages of the members of the 2005 U. S. Olympic Hockey teams. Answer the questions that follow using the information in these plots. Be sure to clearly explain each of your answers. Q1 22 Q2 24 Q3 26 Max 31 Min 18 Min 24 Max 43 Q1 27 Q2 32 Q3 34 a. Which team had the greater range in ages? Women: 31 – 18 = 13 Men Men: 43 – 24 = 19
6) The box plots below show the ages of the members of the 2005 U. S. Olympic Hockey teams. Answer the questions that follow using the information in these plots. Be sure to clearly explain each of your answers. Q1 22 Q2 24 Q3 26 Max 31 Min 18 Min 24 Max 43 Q1 27 Q2 32 Q3 34 b. What percentage of the female players were at least 22 years old? 75 %
6) The box plots below show the ages of the members of the 2005 U. S. Olympic Hockey teams. Answer the questions that follow using the information in these plots. Be sure to clearly explain each of your answers. Q1 22 Q2 24 Q3 26 Max 31 Min 18 Min 24 Max 43 Q1 27 Q2 32 Q3 34 c. True or False? More men were older than 34 than were younger than 27. Both are in the 25 % range.
6) The box plots below show the ages of the members of the 2005 U. S. Olympic Hockey teams. Answer the questions that follow using the information in these plots. Be sure to clearly explain each of your answers. Q1 22 Q2 24 Q3 26 Max 31 Min 18 Min 24 Max 43 Q1 27 Q2 32 Q3 34 d. Which team had the higher standard deviation? Men
6) e. Draw a histogram for the men. Q1 22 Q2 24 Q3 26 Max 31 Min 18 Min 24 Max 43 Q1 27 Q2 32 Q3 34
7) a. Which of the following examples are most likely to have the largest interval ranges for a histogram and interquartile range for a box plot? I I: The weight (in pounds) of 30 people at the mall. II: The ages of 30 people at the mall. III: The amount of money in the wallet of 30 people at the mall. IV: The shoe sizes of 30 people at the mall. b. Which of the above is most likely to have the smallest intervals and quartile range? IV
8) The following are attendance for home football games: 287, 263, 286, 286, 256, 70, 255, and 300. If the attendance for the 6th game (70) wasn’t included, what would be the answer for each of the following? • Which measure would increase the most: • mean, mode, median, or standard deviation? mean b. Will the interquartile range increase or decrease? neither
8) The following are attendance for home football games: 287, 263, 286, 286, 256, 70, 255, and 300. If the attendance for the 6th game (70) wasn’t included, what would be the answer for each of the following? c. Will the range increase or decrease? decrease d. Will the standard deviation increase or decrease? decrease
9) A teacher interviewed 200 students and found the following results: .2(200) = 40 .1(200) = 20 .1(200) = 20 .25(200) = 50 .1(200) = 20 .25(200) = 50 a. How many senior males did the teacher interview? 50 b. If the student was a sophomore, what gender would this student more likely be? male c. How many more female juniors were there than male juniors? 50 – 20 = 30
10) A van holds 15 people. Which of the following would you need to know if you wanted to calculate the approximate total weight of the people in the van? (median, mode, standard deviation, range, or mean) mean
11) Solve the following equations: a. - 5 - 5 x < - 4 b. - 3 - 3 2 x = - 18 x = - 9 2 2
11) Solve the following equations: c. x = 7 / 14 = ½ = .5 14 14 13 = 3 x d. - 2 x - 2 x 3 3 3 = 3 x – 10 x = 13 / 3 = 4.3 + 10 + 10 e. - x = - 17 - 5 - 5 (- 1)(- x) = (- 17)(- 1) x = 17