Examining Activity Patterns Using Fuzzy Clustering
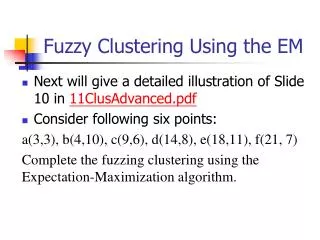
Examining Activity Patterns Using Fuzzy Clustering. by D De Silva, University of Calgary JD Hunt, University of Calgary PROCESSUS Second International Colloquium Toronto ON, Canada June 2005. Overview. Introduction Data Method Preliminary Results Conclusions. Introduction. Context

Examining Activity Patterns Using Fuzzy Clustering
E N D
Presentation Transcript
Examining Activity Patterns Using Fuzzy Clustering by D De Silva, University of Calgary JD Hunt, University of Calgary PROCESSUS Second International Colloquium Toronto ON, Canada June 2005
Overview • Introduction • Data • Method • Preliminary Results • Conclusions
Introduction • Context • Activity-based transport models increasing • Need for grouping into segments • At present seems largely based on received wisdom • Motivations • Opportunity in Calgary • Large Household Activity Diary Survey • Interest in Activity-based model development • Willingness to explore issue of grouping • Increase understanding of activity patterns resulting from behavioral processes
Introduction • Previous work • Fair amount of work drawing in essence on three basic elements • Data interpretation • Similarity or Dissimilarity Measures • Pattern Recognition Algorithms
Introduction • Previous work (Contd.) • Data Interpretation • Some used Time Slices in 5 to 15 minute intervals (Recker et al; Wilson) • Others Disagreed with it and used number of stops made. (Pas) • Similarity or Dissimilarity Measures • Similarity Matrix (Pas;Wilson; Ma) • Sequential Alignment Method (Wilson; Jun Ma) • Walsh-Hadamand transformation, a Fourier Type Analysis, (Recker et al) • Pattern Recognition Algorithms • All have used Crisp Clustering Methods
Introduction • Previous work (Contd.) • Groups with similar activities • Pas – 12 groups based on the number of non-home stops • Recker – 7 Groups based on Socio Economic Data • Wilson – 8 groups Similar to Recker • Applications • To Model Inter Shopping Duration (Bhat) • Micro simulation of Activity Patterns (Kitamura et al; Kulkarni et al) • Extension – the work described here • Time Slices • Sequential Alignment Method • Fuzzy Clustering
DataHousehold Activity Survey (HAS) • 24-hour diary • Fall of 2001 • Sample size • 8,400 households overall • 5,900 on weekdays • 15-minute intervals • activity • location • Activities in 19 categories • Locations • X,Y • Home, Work , Travel, Other • All household members
Activities Covered in HAS • Travel (A) • Pick Up Someone (B) • Drop Off Someone (C) • Work (D) • School / Homework (E) • Shopping (F) • Daycare (G) • Social (H) • Eating (J) • Entertainment / Leisure (K) • Medical / Financial (L) • Exercise (M) • Religious / Civic (N) • Sleeping (O) • Household Chores (P) • Park / Un-park Vehicle (X) • Work-Travel(e.g. Taxi Driver) (Y) • Out-of-Town (Z)
Example Sequence • Activity Sequence of • 30 min Sleep • 15 min Eat • 30 min Travel • 1 hr Work • O O J A A D D D D
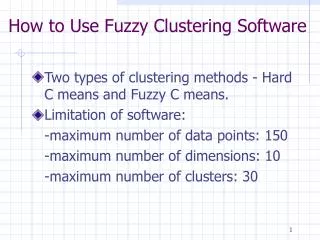
Initial Sample for Testing • Covered in this presentation • 75 persons • 50 households • Just activity type and weekdays (not location & weekends) • Later consider: • Full sample • Weekends and weekdays • Location types as a further dimension
Data Set (Time Slices) Fuzzy Cluster Memberships Dissimilarity Matrix Fuzzy Clustering (S-Plus Software) Sequential Alignment Method (CLUSTALG Software) • Cluster Center Interpretation • Socio Economic Variable Distribution • Fuzzy Weighted Frequency Distributions Groups of Similar Activity Patterns Method
Sequential Alignment Method (SAM) • Alignment Methods first used in field of Molecular Biology for DNA matching • Activity Travel Patterns Intrinsically Sequential • SAM Evaluation of Sequence of Characters • Global Alignment (Whole Sequence) • Local Alignment (Short sequence within entire sequence) • Simplest case is Pairwise alignment
Sequential Alignment Method • Pairwise Alignment • Two Character Sequences • ID 1: O O J A A D D D D • ID 2: O O O J A D D D O • Elementary Operations until equal • Insertions and Deletions (Indel) • Gaps • Gap insertion and extension Penalties • Global Alignment – Needleman & Wunch algorithm minimizing the distance or maximizing the similarity • ID 1: - O O J A A D D D D - • ID 2: O O O J A - D D D – O • Similarity Score = 70 • Lesser operations Similar Pair
Sequential Alignment Method • Gap Opening and Extension Penalties • Role of gap penalty • High Value • Alignment compressed • Literally to matches avoiding gaping • Resemble main activities at their relative times • Recommended values 8 and 3 (Wilson) • Low Value • Identification of similar activities displaced during the day • Better pairwise comparison • Little similarity to the actual activity Pattern • Recommended values 1 and 0.1 (Wilson) • Tested and accepted recommendation of Low Value for Transportation Research (Wilson)
Sequential Alignment Method • Multiple Alignment • Extension of pairwise alignment to N dimensions • Computation power enormous after 10 sequences of reasonable length • Approximation method based on data of pairwise alignment • Use of ClustalG software by Wilson
Sequential Alignment Method • Output is a Dissimilarity Matrix
Fuzzy Clustering • Partition Clustering Method • Number of clusters k - specified in front • The Objects (Activity Patterns) are not assigned to a particular cluster but assigned a membership ranging between 0 and 1 for all clusters • Uses S-plus Software (Kaufman Procedure) • Dissimilarity matrix is input
Fuzzy Clustering • Minimize Objective Function (Kaufman)
Fuzzy Clustering • Number of clusters ? • An Open question – To be determined as part of research • Two quality indices from S-Plus • Dunn’s Coefficient • Average Silhouette Value with Shadow plot
Fuzzy Clustering • Dunn’s Coefficient Where Fk always lies in the range [1/k,1]. • entirely Fuzzy Clustering • Crisp Clustering
Average Silhouette Value (ASV) with Shadow plot Strength of Classification to the nearest crisp cluster compared to the next best cluster Width of Bar 1 – Well Classified 0 – Between two clusters 0< - Badly classified (lies near the next best cluster) Average Value gives a approximation to the best number of clusters ASV must be higher than 0.25 Fuzzy Clustering
Cluster Center Interpretation • Distributions of socio-economic variables • Basis for grouping in subsequent modeling • Person characteristics: • Age • Gender • Person type category from survey • Employment Status • Household characteristics: attributed to persons • Only income so far • Household structure later • Fuzzy weighted frequency distributions • Need for eventual Crisp • Potentially use logit to assign cluster membership values • Calibrate ‘utility functions’ for clusters with person characteristics • Use Monte Carlo to select specific cluster in each case
Cluster Center Interpretation • Fuzzy Weighted Frequency Distributions; • Bar for category in histogram for cluster is Percentage sum of people for that category in entire sample factored by cluster membership
Results • Sequential Alignment • Low Vs High Gap Penalty Results • Cluster plot for 3 clusters Low Gap High Gap
Results • Shadow Plot • Low Gap High Gap • Use low Gap Penalty – consistent with recommendation (1 and .1)
Results • Number of Clusters • Clustal Plot Helps to See the potential range of number of clusters for Clustering
Results • Number of Clusters • Potential range 2 to 5
Results • Number of Clusters (k) • K=2 • Fk = 0.60 ASV = 0.42
Results • Number of Clusters (k) • K=3 • Fk = 0.43 ASV = 0.40
Results • Number of Clusters (k) • K= 4 • Fk = 0.34 ASV = 0.32
Results • Number of Clusters (k) • K= 5 • Fk = 0.28 ASV = 0.20
Results • Number of Clusters (k) ? • Use 3 clusters for testing • Expect different for total sample
Fuzzy Cluster Memberships • Output of S-plus software • HH2701 has almost equal memberships to all three clusters -
Results Fuzzy weighted frequency Distribution
Results Crisp presentation Cluster Interpretation
Results Cluster Interpretation - tends to be more; • Cluster 1 • Students age of 5 to 15 • Mainly KEJS and youths • Cluster 2 • Females • Seniors and other adults in Age range 66-70 • Retired home makers and volunteers • Cluster 3 • Males • 100% Adults workers • Age 40’s • Majority Adults workers not needing a car to work • Expect different for total sample
Conclusions • Methods seems to work well to identify the clusters as intended – no hurdles. • Fuzzy clustering better indicate strength of membership • Best to have multiple measures “quality” of clustering regarding number of clusters • Still work in progress • Results not complete – just for example • But essential elements of analysis process set
Conclusions • Future Work • Proceeding to full sample of 8,400 households including Weekends • Expanding to location dimension • Calibrate Logit model for allocation of clusters • Consider Household Structure